Visualizing My Location History
We know Google is constantly tracking our real-life location and movements through Google Maps in our Android phones. You can see your location history as tracked by Google on the Google Maps Timeline.
With that said, they are required to provide a way to download all of this data, and they do so via the Google Takeout page. From there we can obtain our location data in the from of JSON files, and it is then relatively straightforward to parse and convert theses files to a more convenient format like GeoJSON or GPX. You can check out Location History Format for more help on understanding the extracted files (disclaimer, I built that site).
Once converted to a more convenient format, we can load the data into QGIS, a very powerful open-source application great for working with geospatial data and creating map visualizations.
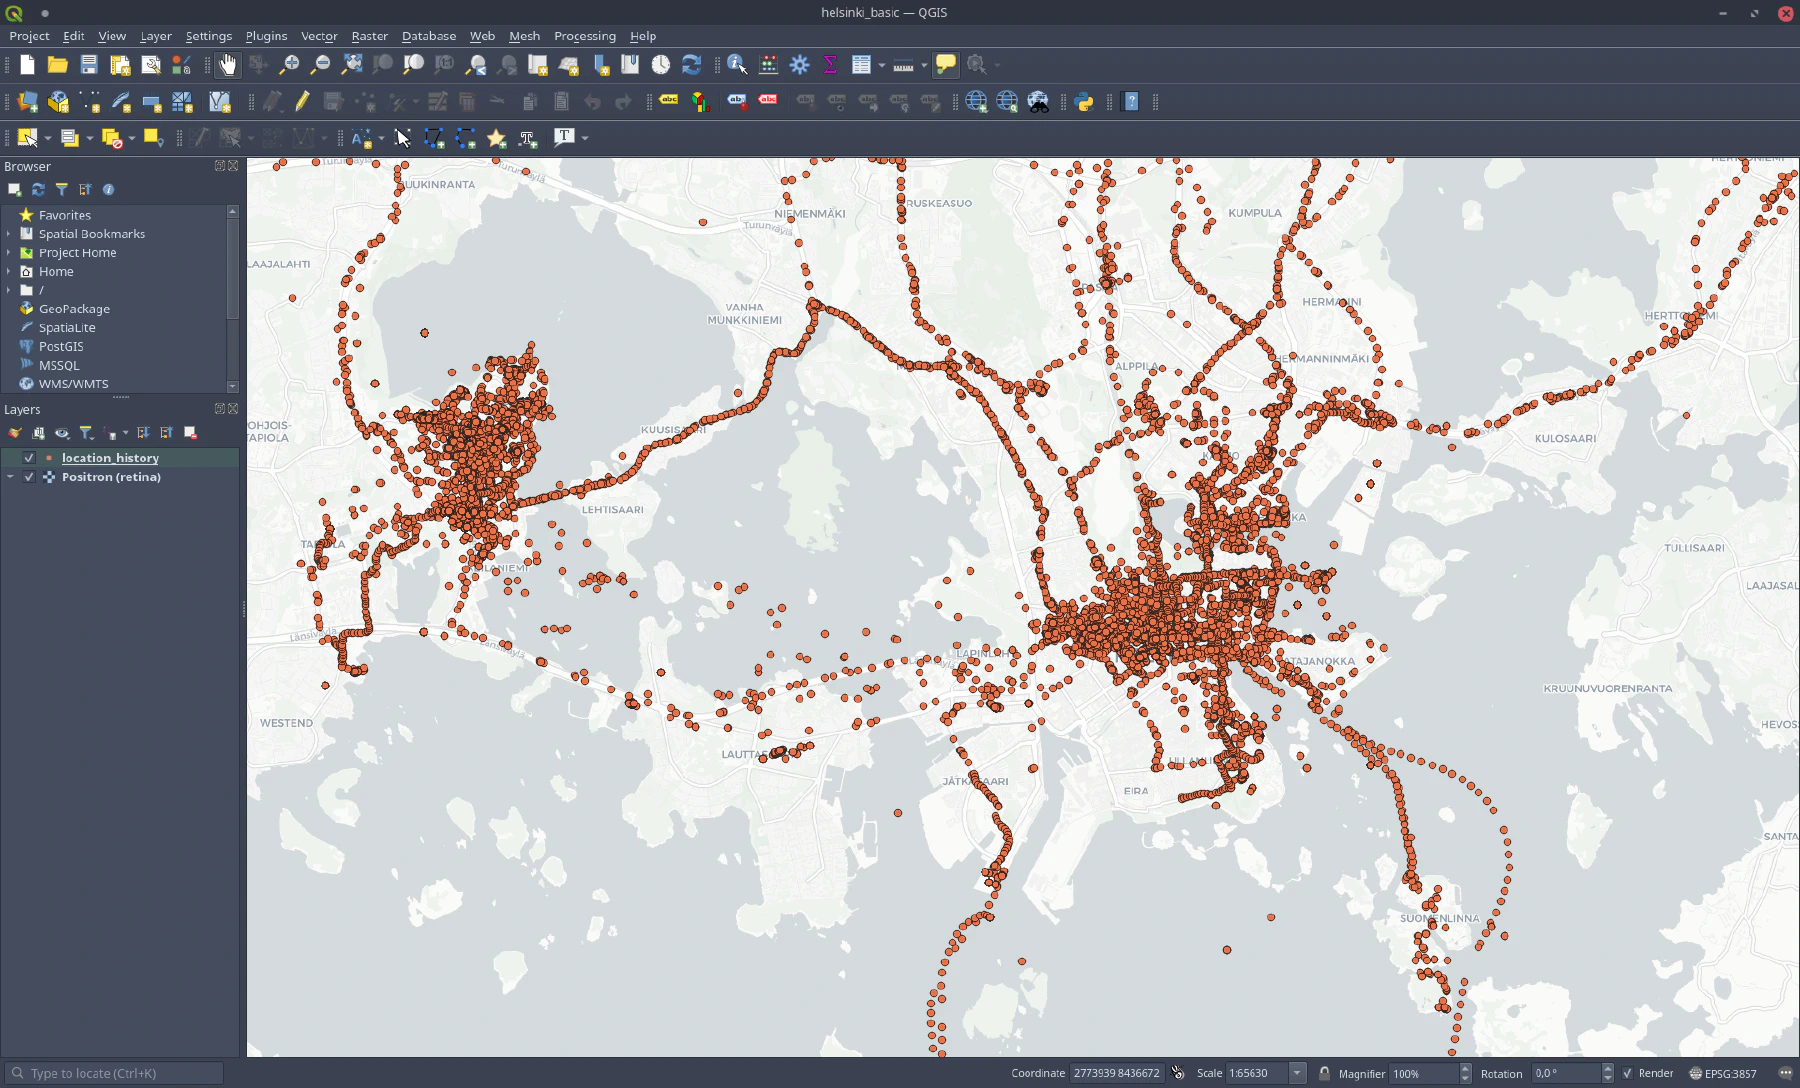 Location History data loaded in QGIS.
We can now customize and style the visualization with QGIS however we want, and maybe apply some post-processing effects with an image editor.
Gallery
I played around with different visual styles and different areas and time frames. Here are some of the results:
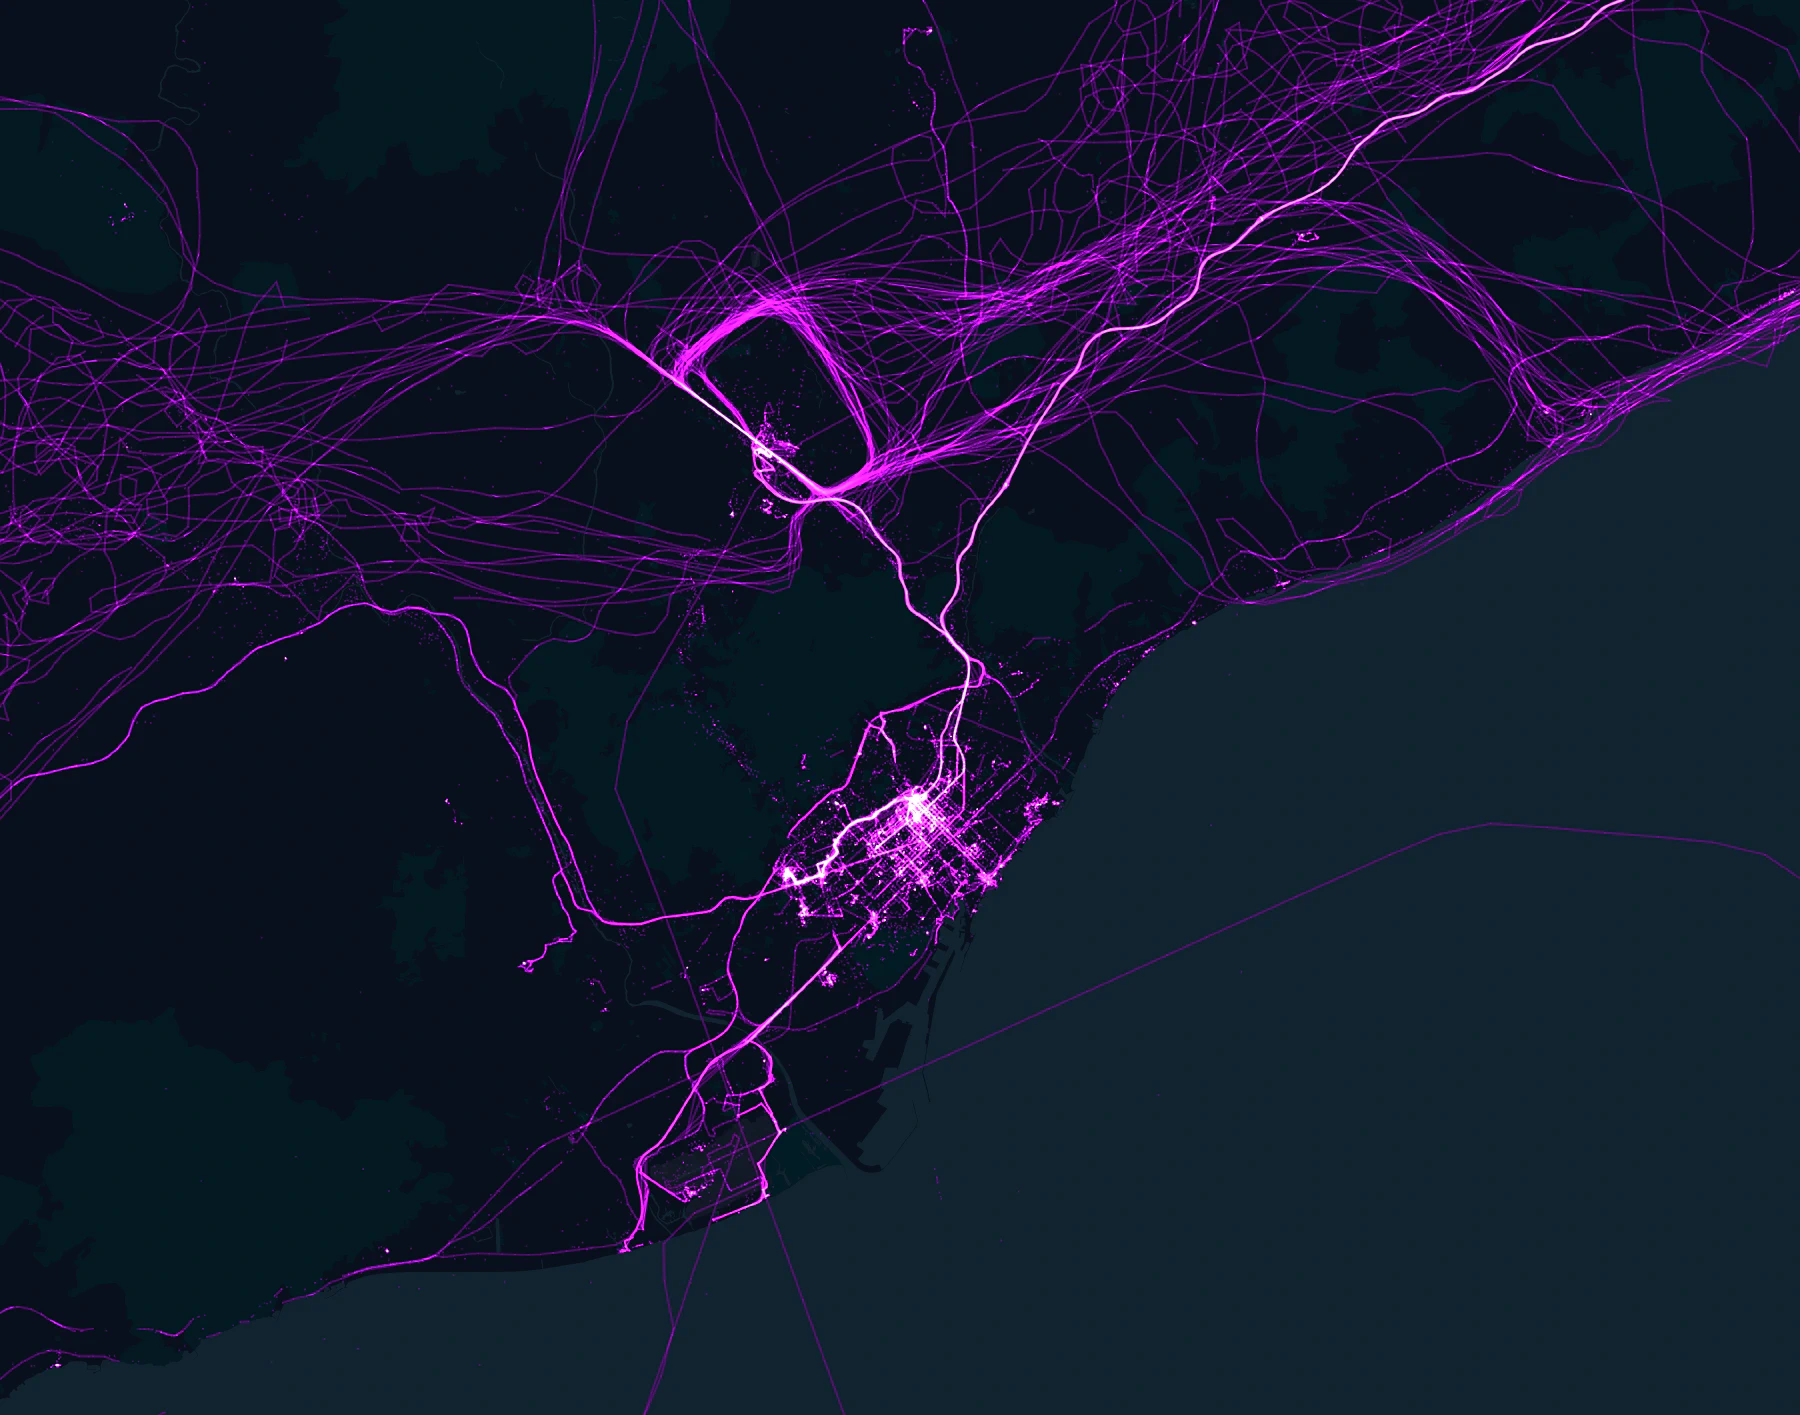 Living and Flying in Barcelona, 2016-2022.
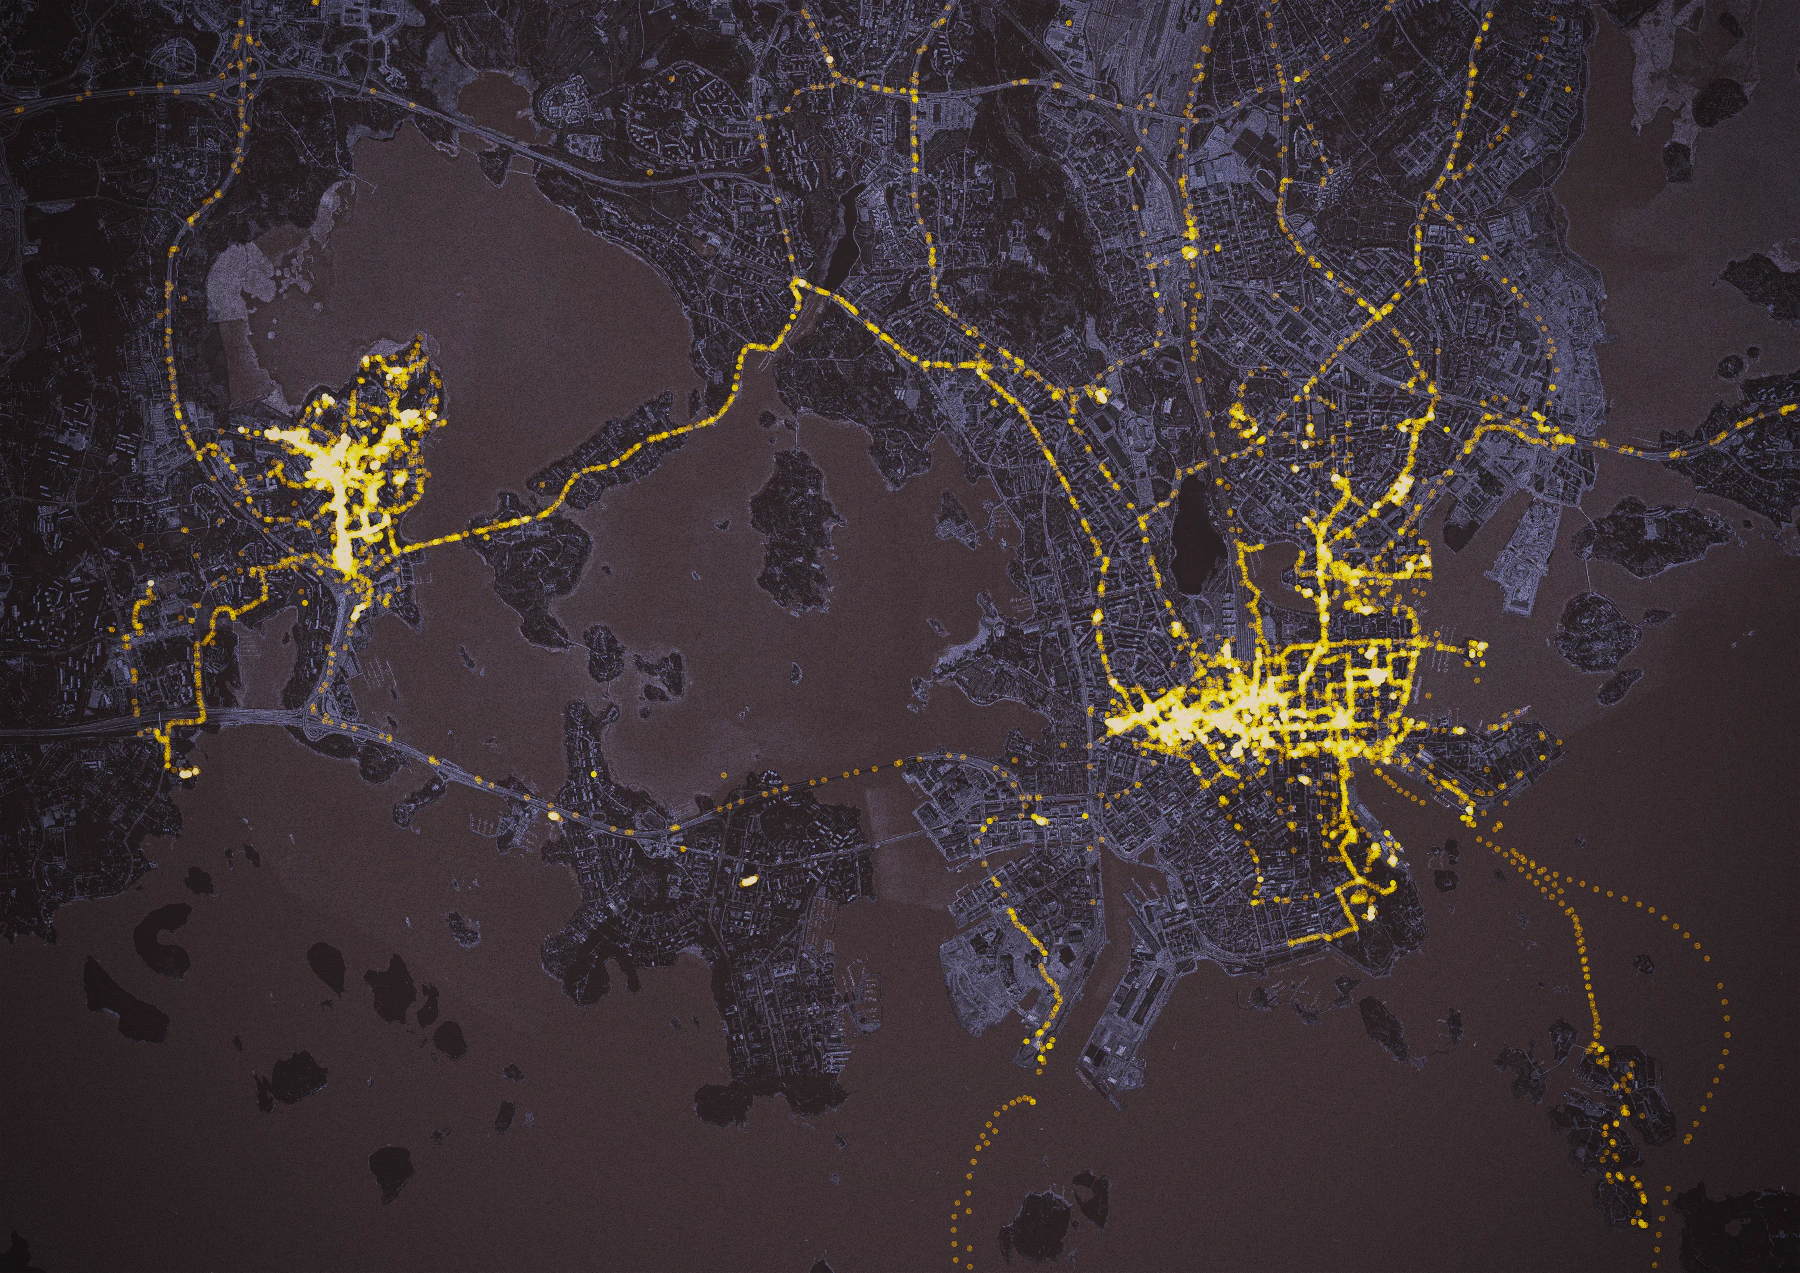
Living in Helsinki, 2019-2022.