Making Sense of X-Plane Airport Files
X-Plane provides and manages a very large, open, and collaborative database of airports data accessible via the X-Plane Scenery Gateway. This database contains information about more than 35,000 airports around the world, and, for each one, it describes the positions, sizes, and various other properties of many airport elements, such as runways, taxiways, aprons, and other airport equipments and systems. This data is used by the X-Plane simulator to populate its virtual world with detailed and accurate airports.
This data is provided in the form of apt.dat files, a custom format developed exclusively by, and for X-Plane.
The X-Plane apt.dat File Format
In short, files in this data format are simple text files where each line consists of a whitespace-separated list of fields. For example, this is how part of the Barcelona-El Prat airport data looks like:
...
100 45.11 1 1 0.00 1 2 0 02   41.28773163  002.08481973    0    0 3 0 0 0 20   41.30928753  002.09466380    0   71 3 0 0 0
100 60.05 1 1 0.00 1 3 0 07R  41.28231220  002.07434998    0   63 3 2 1 0 25L  41.29222053  002.10328099    0   62 3 2 1 0
100 60.05 1 1 0.00 1 3 0 07L  41.29324514  002.06727495  430    0 3 2 1 0 25R  41.30572604  002.10372898    0  159 3 2 1 0
102 H1  41.30948338  002.09925360 269.61 75.00 60.00 2 0 0 0.00 1
110 1 0.00 0.0000 New Taxiway 52
111  41.28249499  002.07340392
111  41.28170796  002.07388696
111  41.28196525  002.07463748
111  41.28246756  002.07434089
111  41.28298097  002.07584273
111  41.28318119  002.07571444
112  41.28318613  002.07563846  41.28320146  002.07561991
113  41.28324558  002.07561847
110 1 0.00 65.5000 RWY's 07R25L
112  41.28776425  002.08392136  41.28775075  002.08386607
111  41.28776425  002.08392136
112  41.28776425  002.08392136  41.28773382  002.08379675
111  41.28757547  002.08307368
112  41.28761797  002.08302971  41.28767425  002.08304142
112  41.28822906  002.08317325  41.28831524  002.08319666
111  41.28845453  002.08326652
111  41.28797797  002.08172794
...
This is only a partial extract of the file, the complete data for the Barcelona-El Prat airport is more than 20,000 lines long.
The first field in each line is always a numeric code indicating the type of line (row code). The row code indicates what type of information the line contains (and therefore also how many fields the line will have and how the line should be parsed).
For example, lines that start with 100 describe runways. In this case, Barcelona airport has 3 runways (described in the 3 lines that start with 100).
Runway lines in the file therefore have runway specific information, such as the runway width, the second field in these lines
(Barcelona has one 45-meter-wide runway, and two 60-meter-wide runways).
Additionally, certain types of lines (based on their row code) indicate the beginning of a block of lines,
allowing for the existence of multi-line features, such as taxiway markings (blocks that start with a line with row code 110),
where the coordinates for each point of the path is in a separate line in the file.
In this way, apt.dat files can actually form a hierarchical nested structure of groups of lines.
Information about all possible row codes and details about the format specifications can be found here:
- Airport Data (apt.dat) 11.00 File Format Specification
- AIRPORT DATA (APT.DAT) 1100 Specification Document
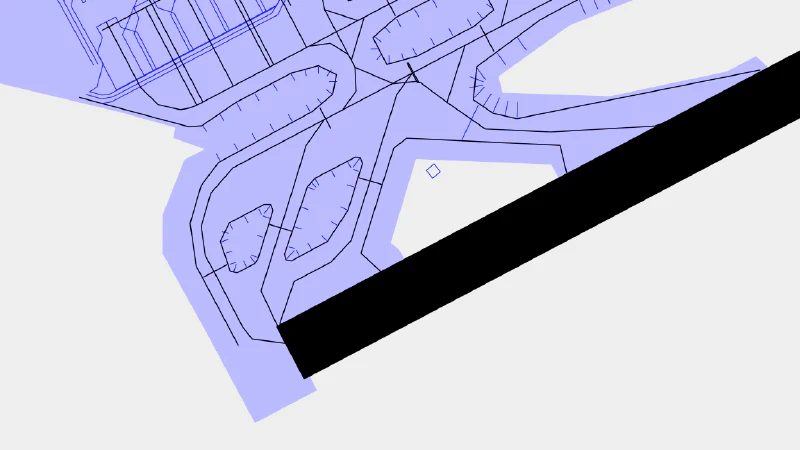
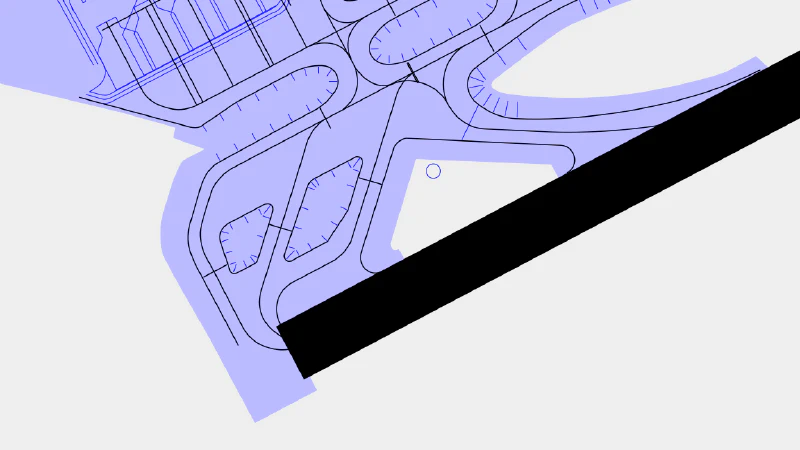
Bezier Curves
One of the particularities of the apt.dat file format is the way in which it describes paths (for taxiways, ground markings, surface boundaries…).
Many geospatial vector file formats stick to discrete linear paths defined by a sequence of points to construct paths.
The X-Plane apt.dat file format instead uses a combination of discrete linear segments and Bezier curve segments.
This is more similar to CAD-based formats and also to how SVG paths are defined.
The clear benefit of this is that the resulting curves have infinite resolution,
the curves can be smooth at any arbitrary scale since they are defined mathematically.
Additionally, the memory required to store the curves in the apt.dat file is minimal
compared to the memory that would be required to store a smooth curve made up of many discrete points.
The way Bezier curves are defined in apt.dat files is unfortunately not documented well enough in the format specification (linked above),
and leaves a lot of room for guesswork.
Luckily I found the discussion in this thread to be very useful:
Tools
Apart from the X-Plane simulator itself (which reads apt.dat files to inform its global scenery),
an official dedicated software called WorldEditor (WED) is provided
that allows creating and editing airport data in these apt.dat files in a user-friendly way.
This is however still very constrained to the X-Plane ecosystem. I was interested in being able to use and work with this data in a more open and standard GIS context, and to be able to conduct data analysis and create custom visualizations and maps.
For this purpose I first came across a promising GDAL/OGR extension,
part of the gdal-extra-drivers project,
specifically developed to read X-Plane apt.dat files and convert them to more friendly formats via the ogr2ogr program.
This extension however, has been deprecated and unmaintained for some time now, and only supports old apt.dat files version 810 and 850,
while the most recent version at the time of writing is version 1100 (and a 1200 version is potentially coming soon when X-Plane 12 gets released).
After some further searching I was not able to find any other tools that would help me in this task, so I decided to build my own. After all, it seemed like a fun challenge.
xplane_apt_convert Python Library
I developed a Python library that I called xplane_apt_convert.
It is available on GitHub and on PyPI.
As the name suggests, the library’s goal is to convert X-Plane airport apt.dat files to other formats (many common GIS vector formats are supported).
I don’t intend on the library to be completely exhaustive with the apt.dat format and to cover the complete format specification,
I only covered the parts that I’m interested in.
With that said, I am happily open to accepting pull requests that expand the library’s functionality.
As part of the conversion process I need to discretize the Bezier curves since the output GIS formats I’m working with only describe lines as a sequence of points. To do this I make use of the bezier Python package. The desired output resolution can be defined as an argument.


One of the caveats to keep in mind in this discretization process is that it assumes that the data points are projected and in a 2D plane, when in fact the input Bezier coordinates are defined using geographic coordinates (degree angular units for a round Earth). The resulting discretized lines will show a small degree of distortion, more notable the larger the line is and the closer to the poles it is. Given that the size of airports lines is relatively small on a local scale, the level of resulting distortion is usually negligible. Another small thing to keep in mind is that the process won’t work for lines that cross the +180/-180 meridian, this is not a problem with most airports that I’m aware of.
Usage
The xplane_apt_convert library can be used both as command line application, or directly within a Python module.
For example, when using it from the command line, we can run the following command to obtain the Barcelona-El Prat airport (LEBL) layout in GeoJSON format:
python -m xplane_apt_convert -a LEBL -g -o ./out/ -d GeoJSON
See the GitHub page for more information on how to use the library.
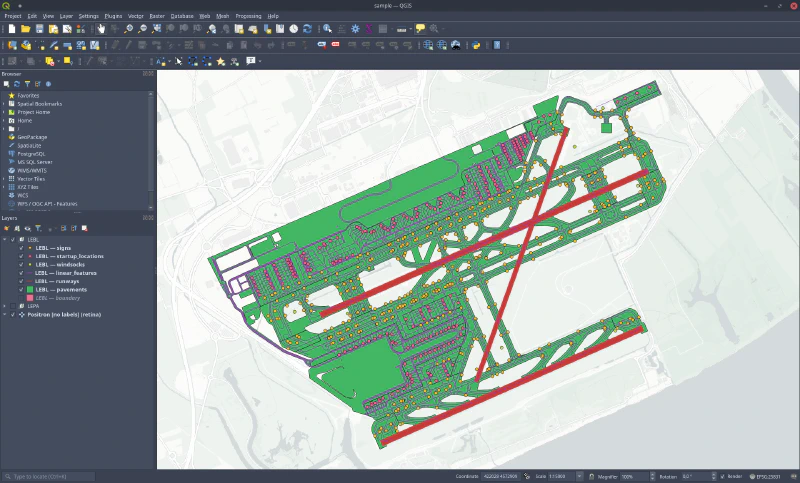
Once we have the data in GeoJSON format (or another standard format) it is quite straightforward to load the file with QGIS or with other similar GIS tools.

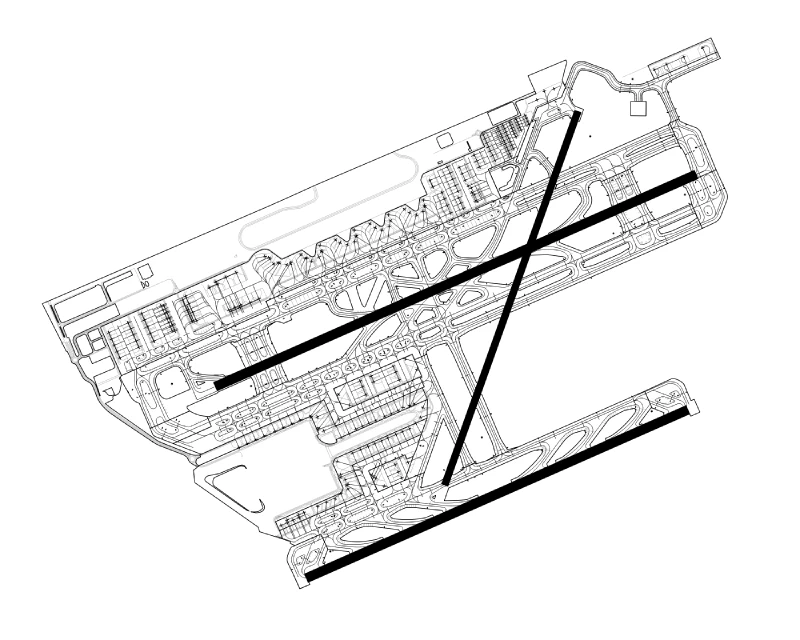
From there, and after applying some very basic styling in QGIS, I was able to produce images like the one at the beginning of this post.
