Drawing Airport Diagrams
 R-2 apron at Sabadell Airport.
Table of Contents
Airports are very interesting and rich places from a GIS perspective. They can feature complex networks of taxiways, runways, roads, aircraft stands, gates, and much more. For this reason, they can be great playgrounds for exploratory analysis, data visualizations, and maps.
In this article I’ll focus on an exploration of different sources for airport layout data with the purpose of creating airport layout maps.
Data Sources
Obtaining such airport data is not necessarily straightforward. I was interested in finding a reliable source that provided GIS airport layout data that was free, open, accurate, complete, up-to-date, and with global coverage. I considered and explored different options that I’ll discuss in the next sections.
Official Aeronautical Sources
The first option should always be to go directly to official sources. In this case, this corresponds to consulting the data published by the different regional aviation authorities.
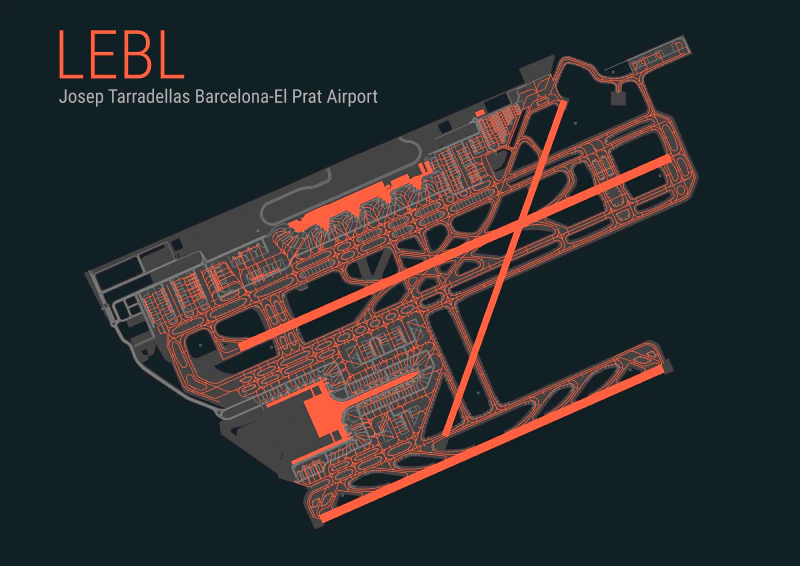
For the airports in Spain, this responsibility lies in Enaire, the air navigation manager authority in Spain. They provide what’s known as the Aeronautical Information Publication (AIP), which, among many other things contains airport charts like the ones shown here for the Barcelona-El Prat airport (LEBL):
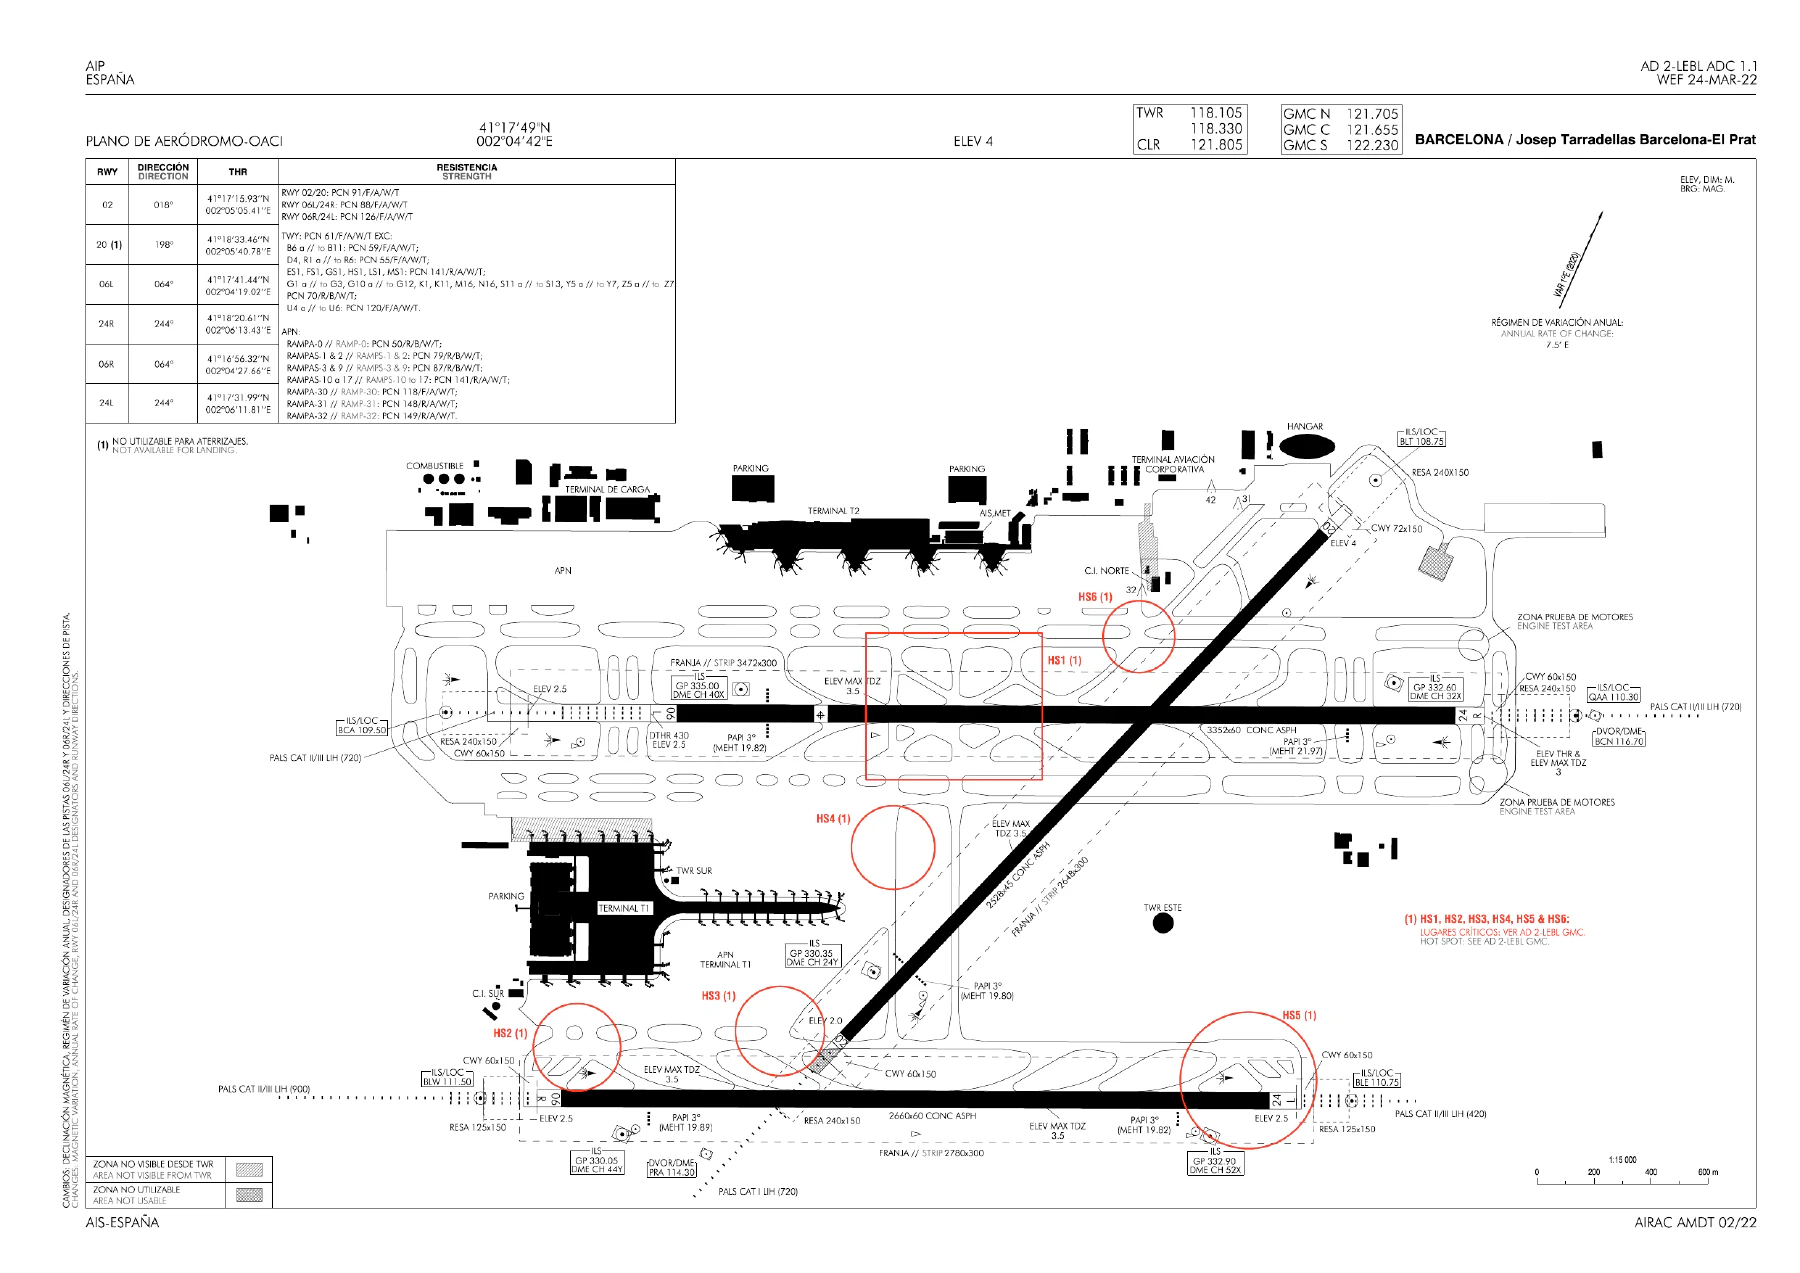
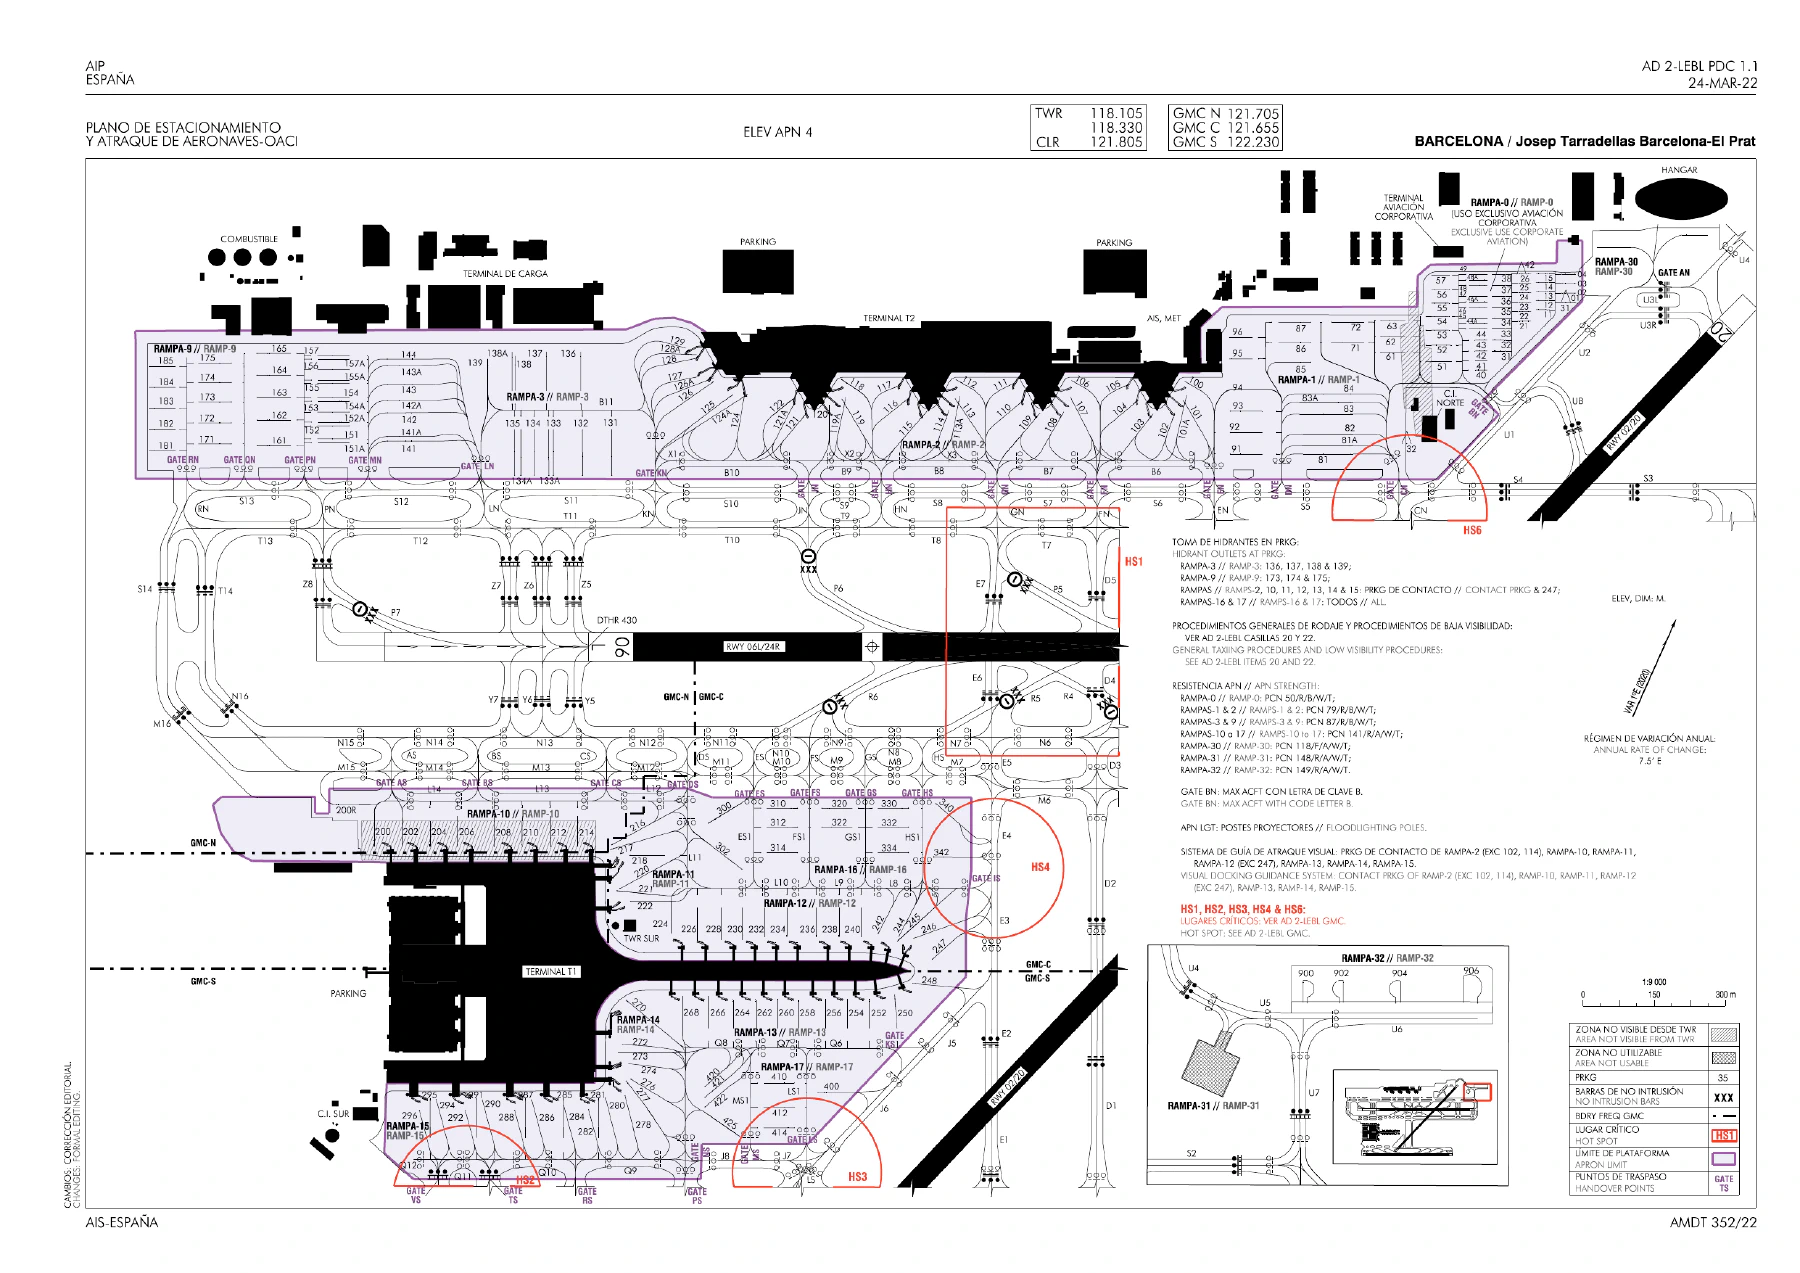
The data published by these sources is the most reliable and can be assumed safe to use for real world navigation as long as it is up to date.
One of the clear big limitations of these sources is the way in which they distribute their data, usually in the form of PDF files meant to be used as printed materials. While great for day-to-day use by pilots and operators, these files are not practical for building customized visualizations or conducting GIS analysis (even though the PDFs are sometimes georeferenced).
Another obvious limitation is that the data is region-specific. Usually each country formats and distributes the data in their own custom way. External professoinal services exist that provide a unified ecosystem of charts for the whole world (like Jeppesen for real-world flying, or Navigraph for simulation flying). These services however, are usually not open and not free and have the same format limitations.
OpenStreetMap
Another of the main options that quickly came to my mind is OpenStreetMap, the biggest open and collaborative geographic database of the world.
OpenStreetMap is a general purpose mapping project, and thus, the data it contains is not technical aviation information, but it can nonetheless be useful for aviation as it contains geographical information about airports and heliports and their physical infrastructure. For my specific purpose I was not interested in all of the data that OpenStreetMap holds, but only in the aviation specific data (runways, taxiways, etc.), which happen to be nicely identified via the aeroway tag.
To simplify things further, I didn’t even have to do the filtering myself, instead, I made use of the aeroway extract from osmdata.xyz. This site provides thematic ready-to-download extracts of the OpenStreetMap data, updated every month.
One disadvantage of the OpenStreetMap data is that, due to the nature of the database, no general index of airports exists, and therefore, isolating and identifying airports in the database is not really straightforward. Airports in OpenStreetMap are just the result of the union of all of their geometric parts (points, lines and polygons), but these parts don’t naturally conform a single airport entity, the different parts of an airport are often not connected to each other.
Therefore, even counting the number of airports that exist in OpenStreetMap is not a simple task.
A good and easy proxy is to count the number of features that have tags like aeroway=aerodrome or aeroway=heliport in the database.
One needs to be aware that these sometimes correspond to points, but sometimes correspond to polygonal boundaries.
Similarly, taxiways and runways sometimes correspond to lines, but sometimes correspond to polygonal shapes.
It is also not unusual to find runways and taxiways without a corresponding feature tagged with aeroway=aerodrome nearby.
In most cases this seems to correspond to closed/abandoned airports, or to model airplane (RC) fields.
With this considerations in mind, we can still get a good idea of the very extensive global coverage of airports that OpenStreetMap provides:
 Features tagged with `aeroway=aerodrome` or `aeroway=heliport` in OpenStreetMap. A total of 45,135 as of 2022-07-10.
A total of 45,135 potential airports (or heliports) are marked in OpenStreetMap at the time of writing.
We should also keep in mind that the presence of an aeroway=aerodrome tag is not a guarantee
that the airport layout (runways, taxiways, etc.) will be mapped as well.
And we should expect to find varying degrees of detail in different airports in the database.
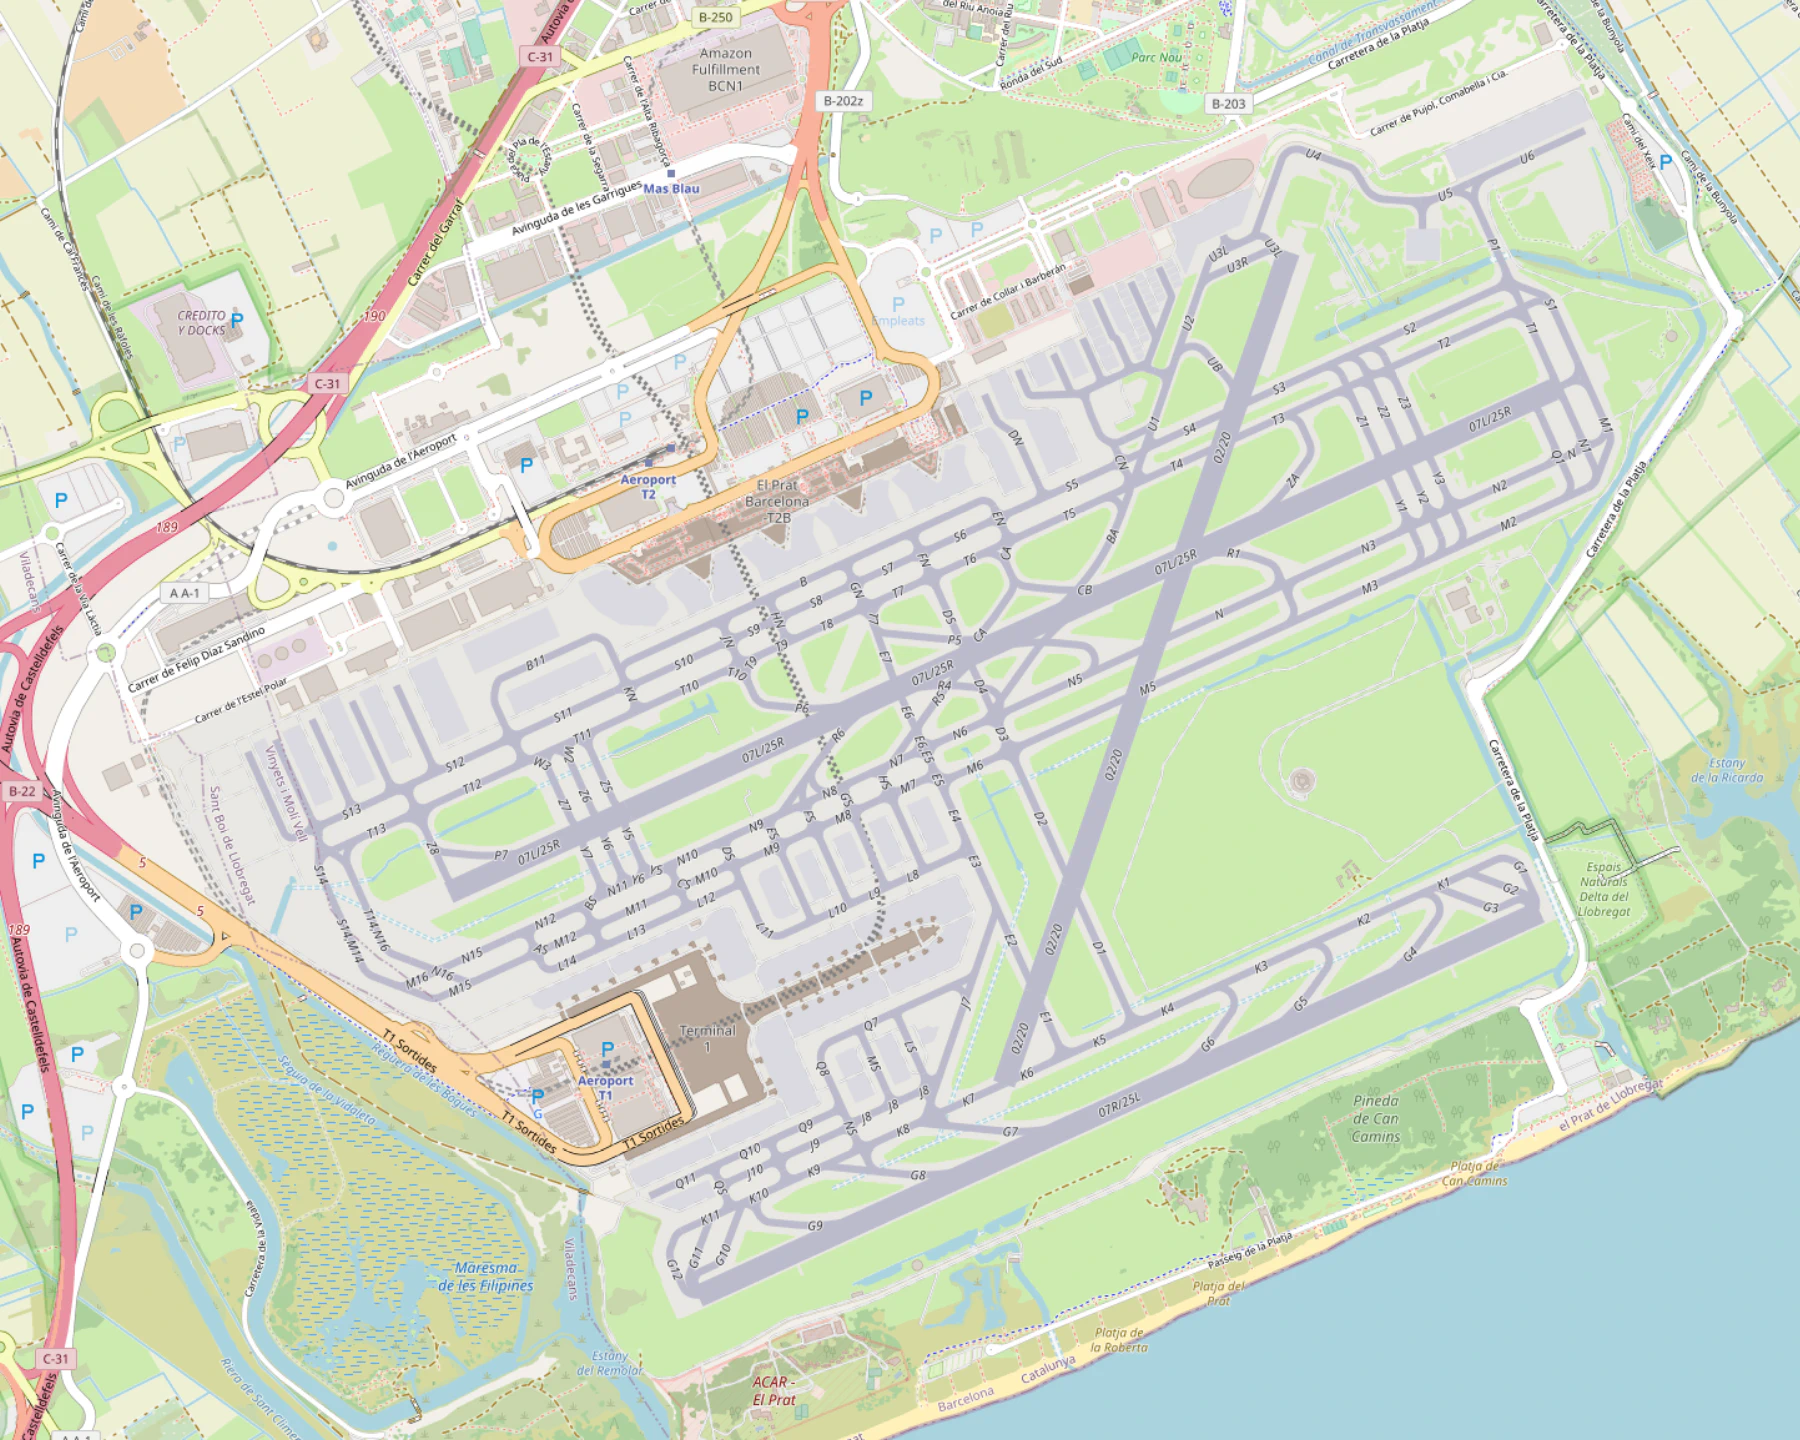
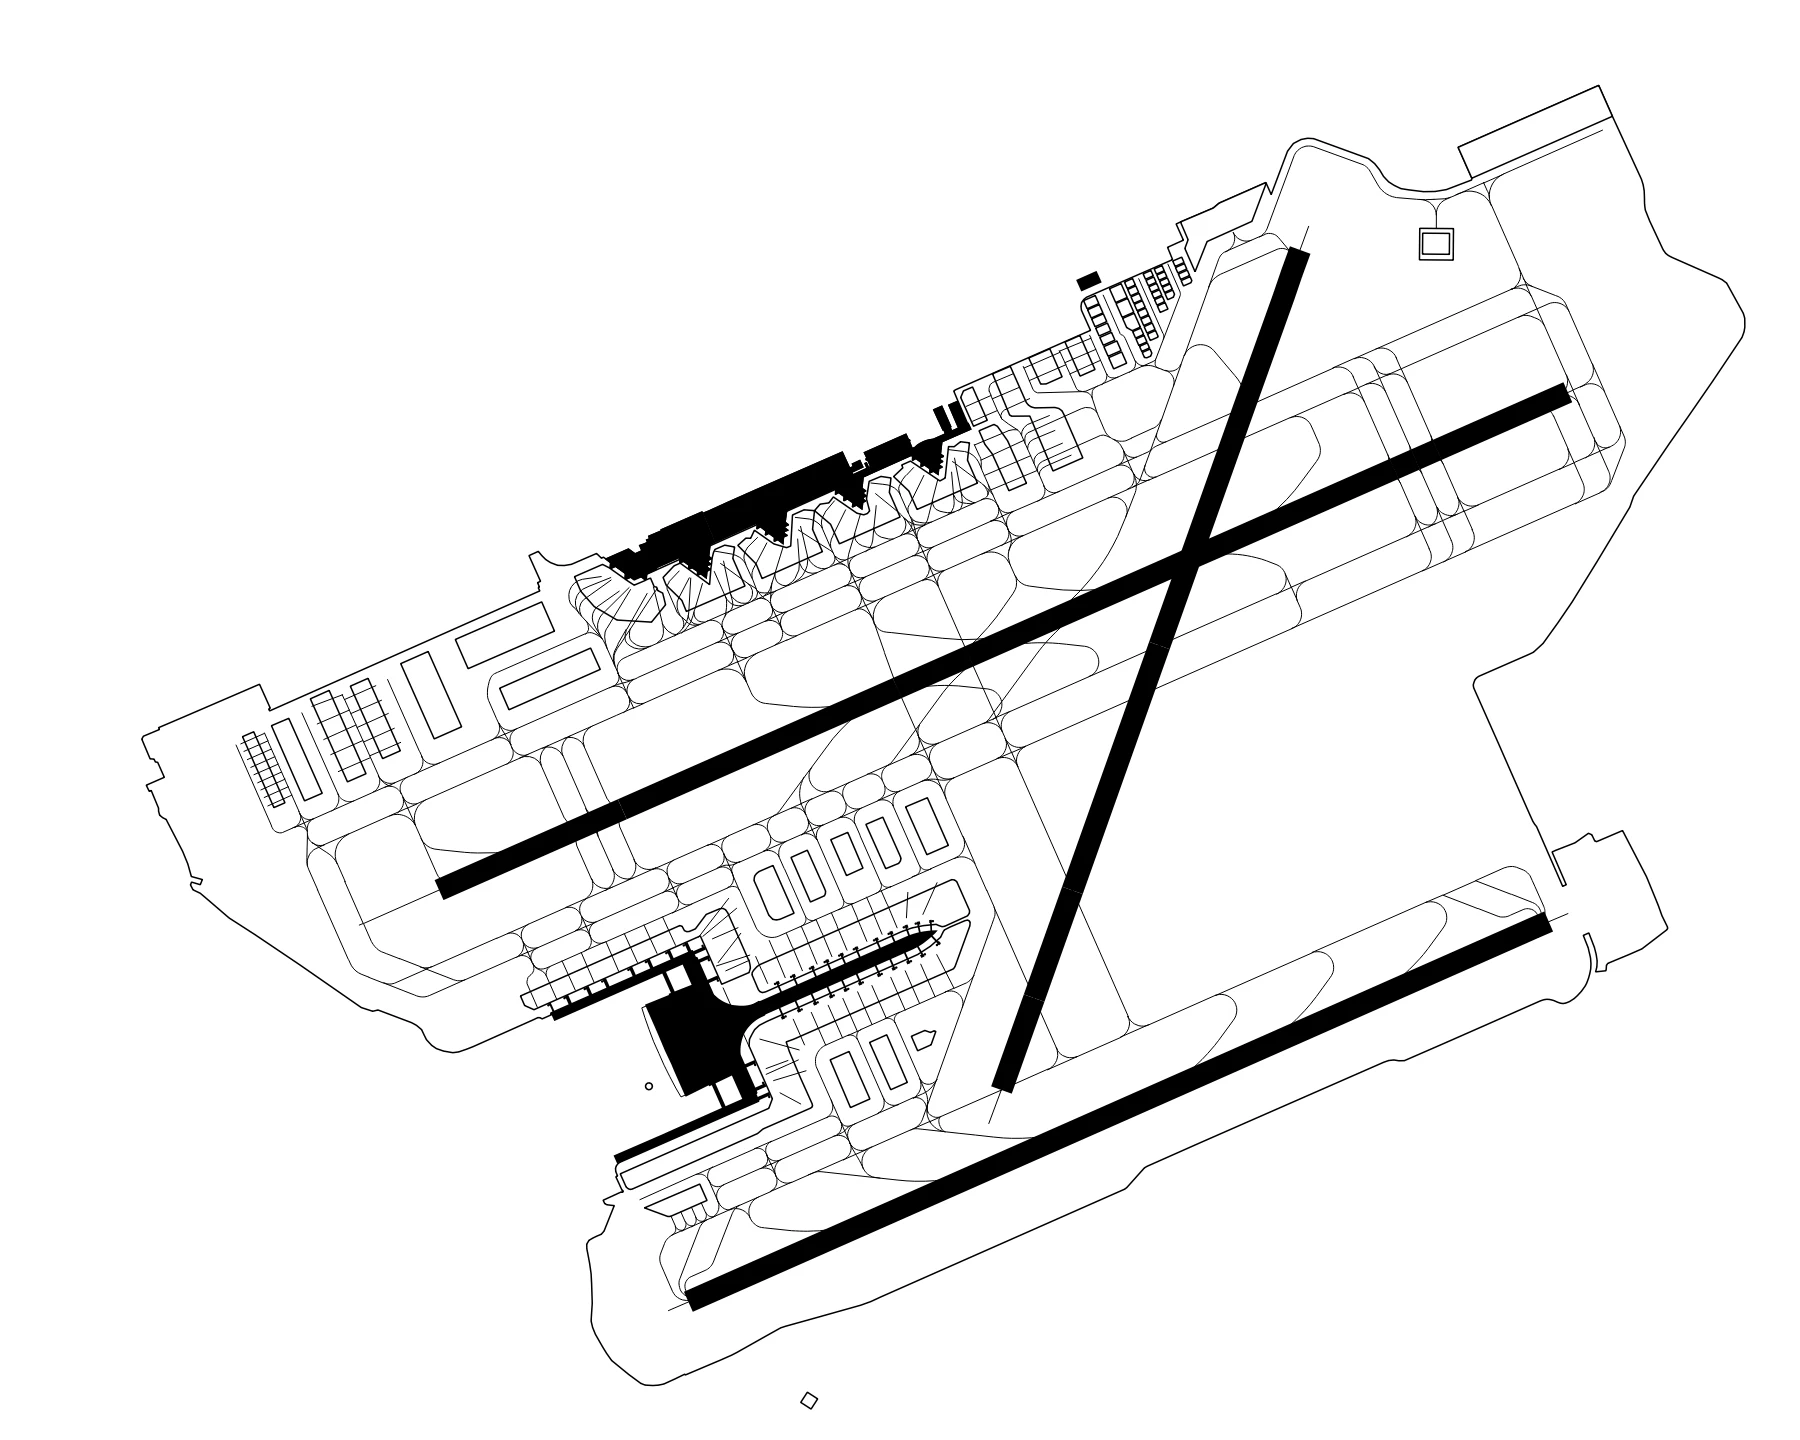
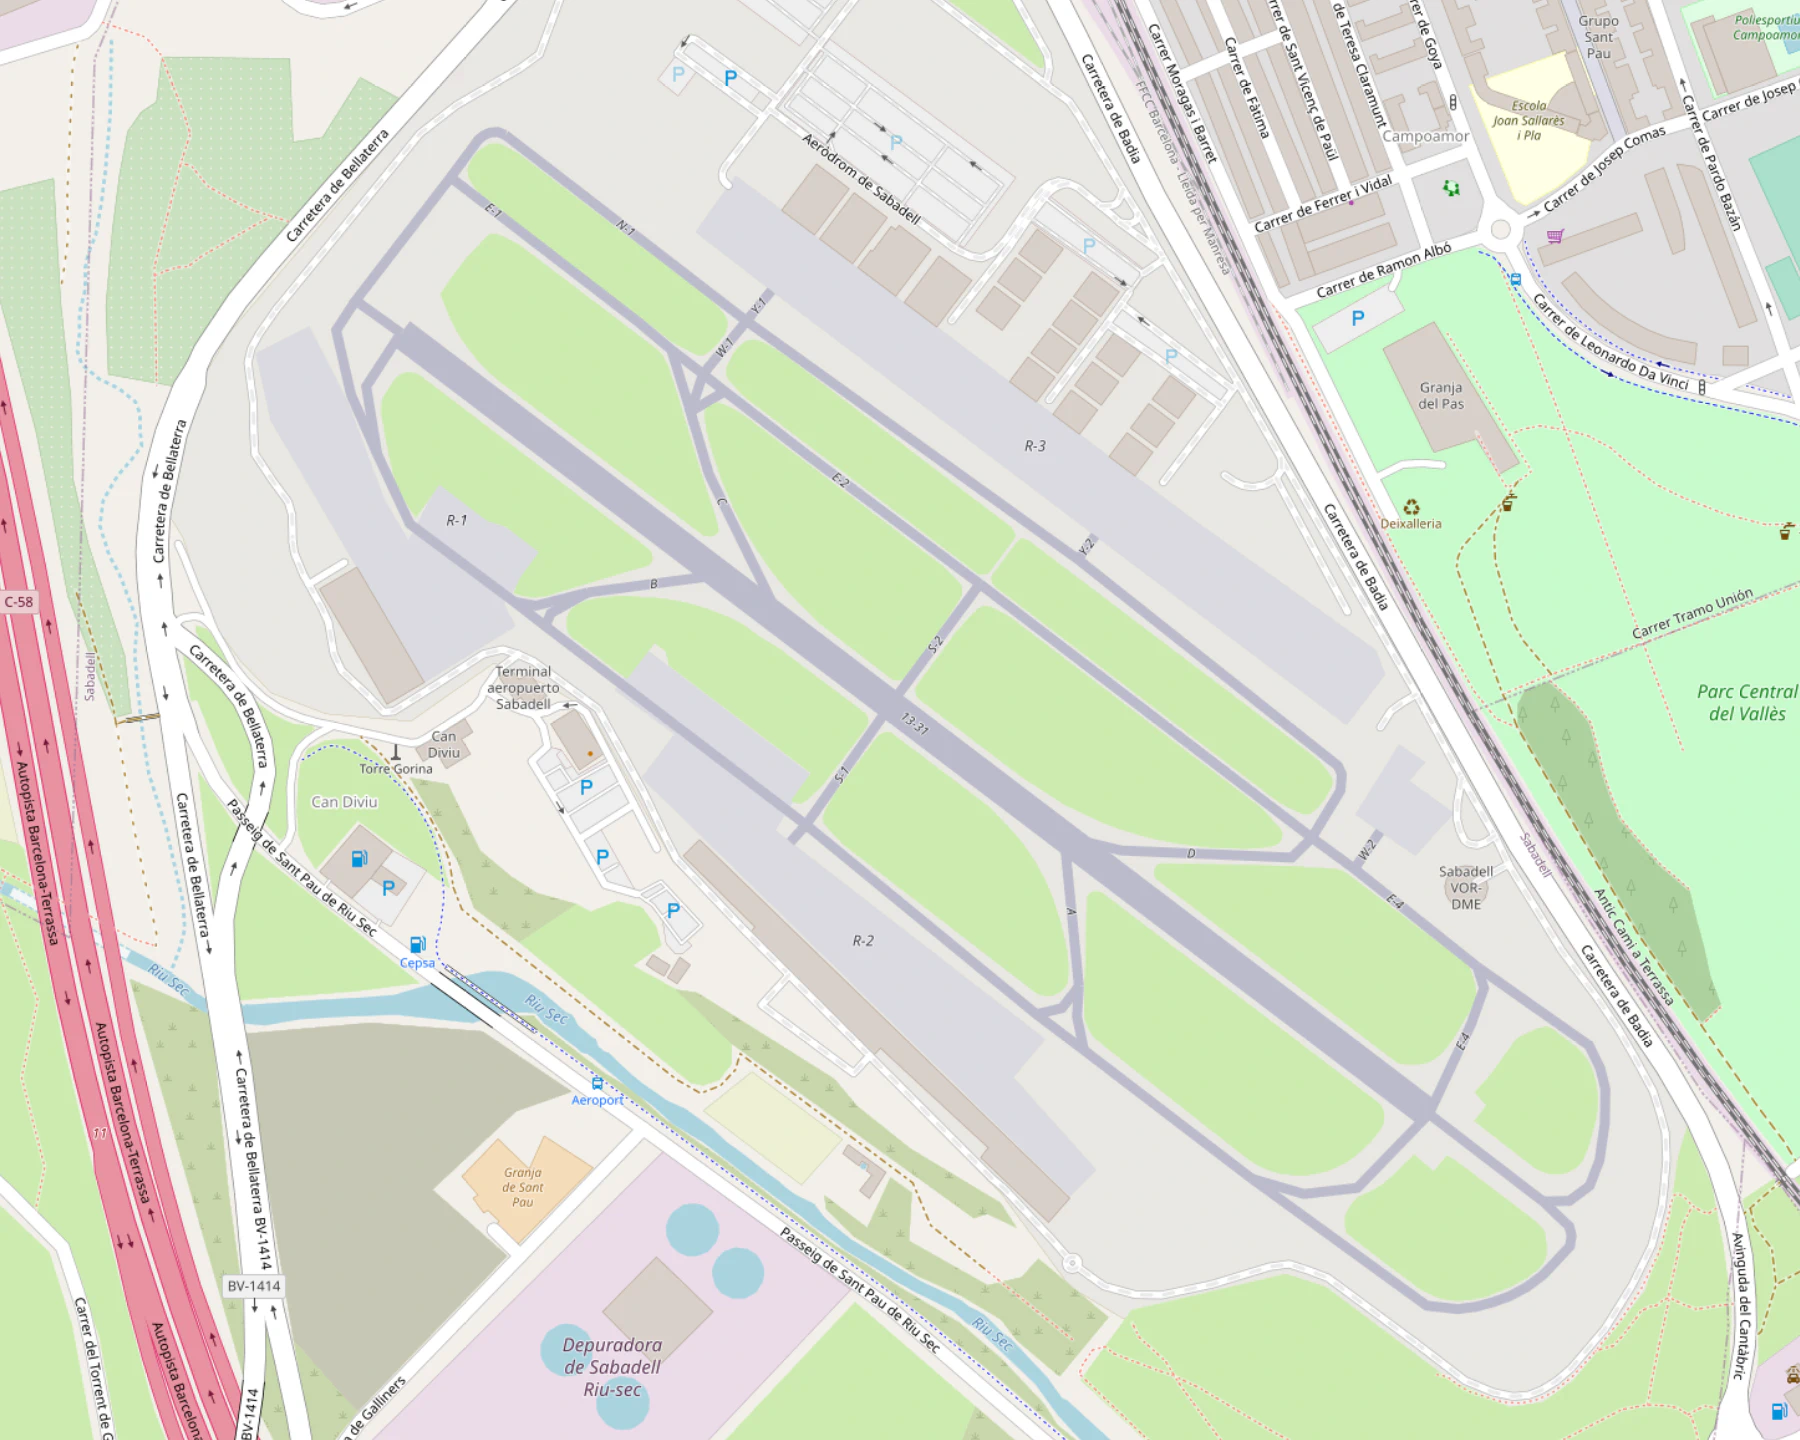
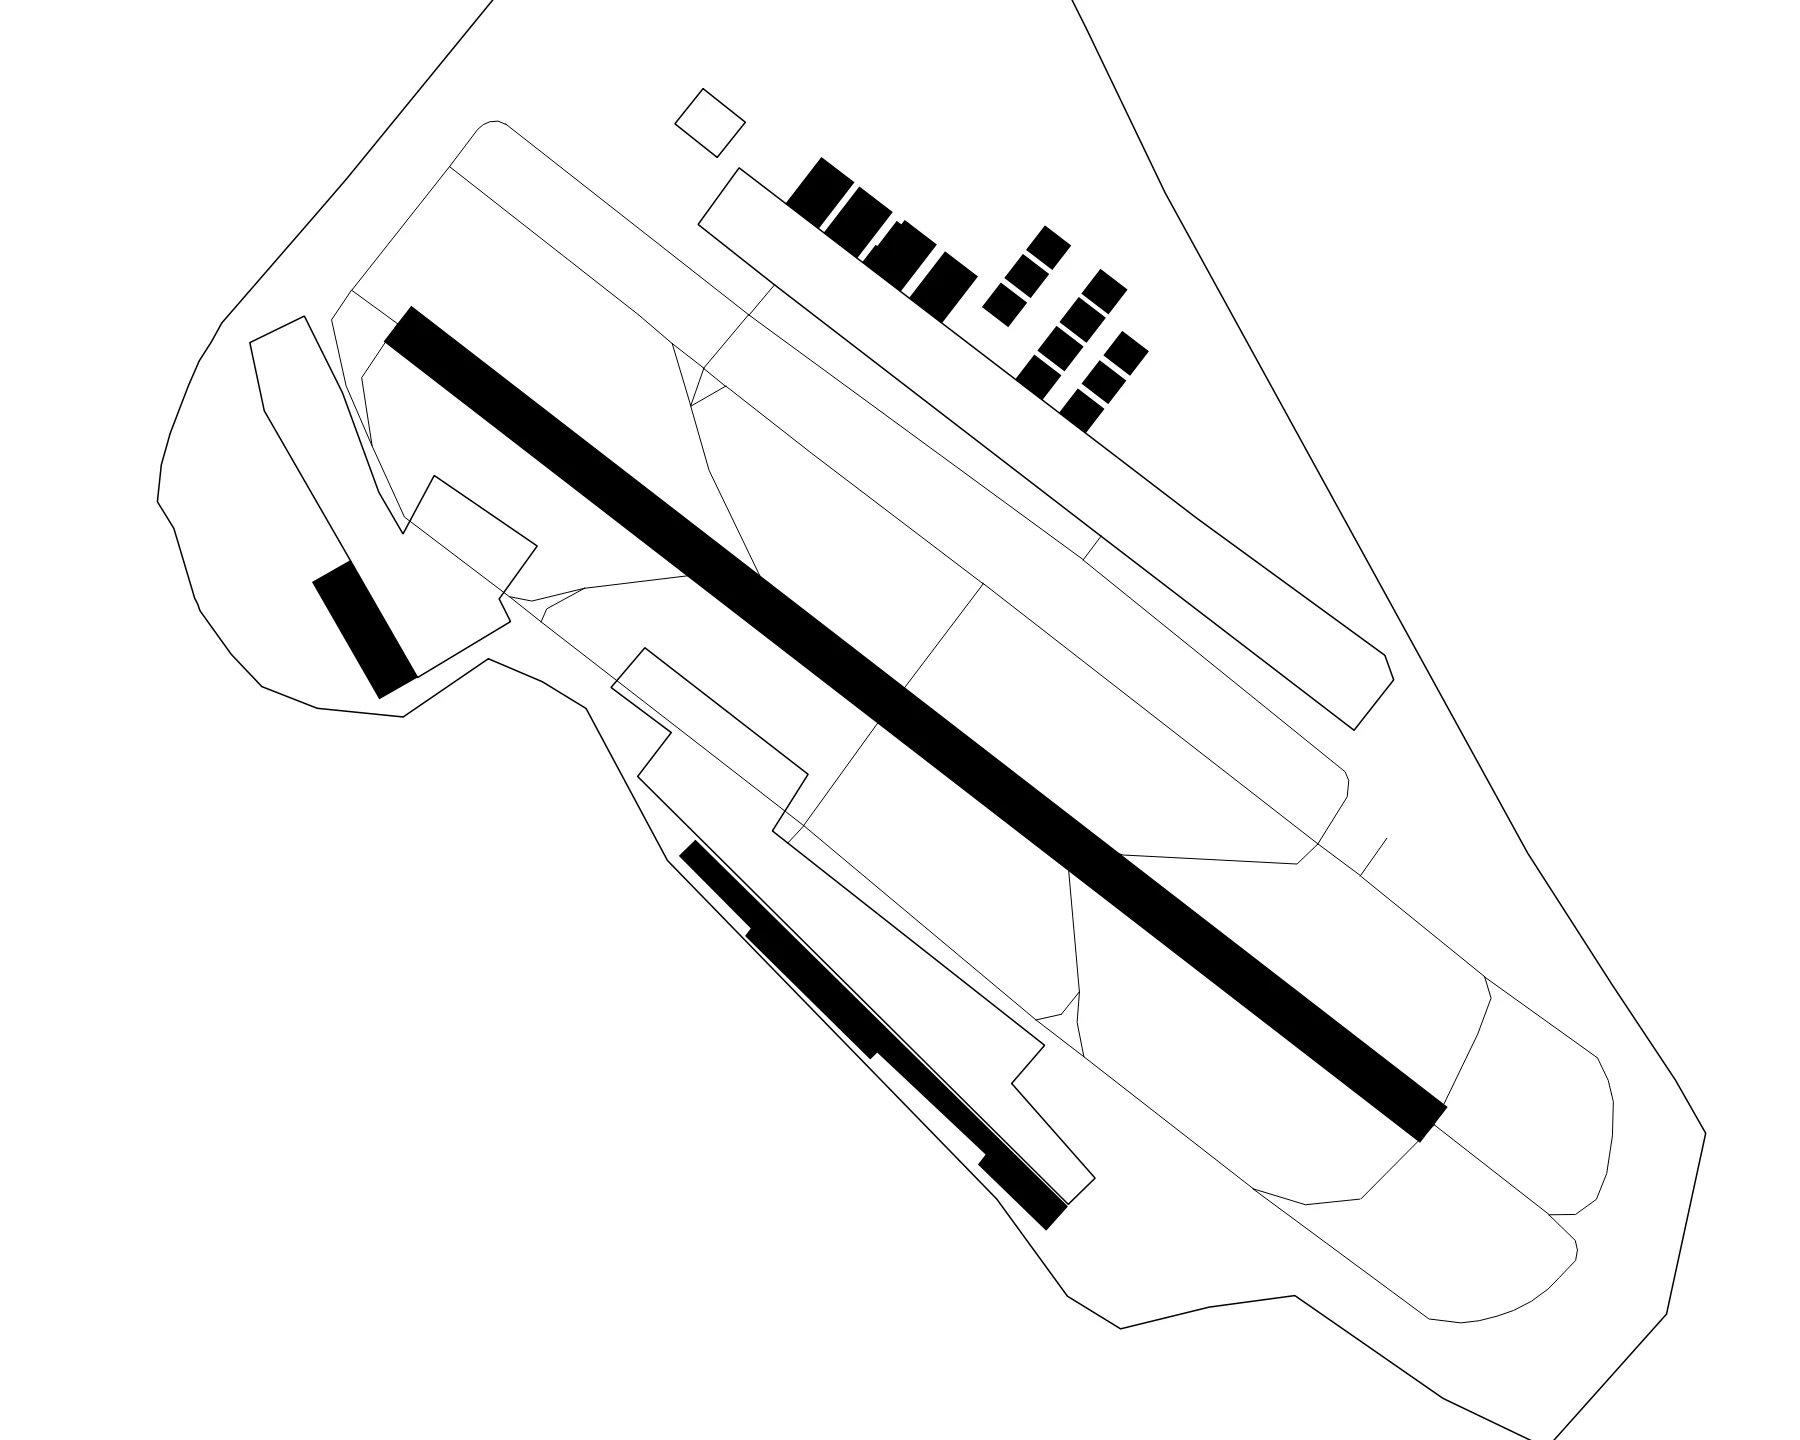
As an example, this is how the OpenStreetMap data for the Barcelona Airport looks, viewed through the default standard OpenStreetMap map on the left, and directly visualizing the relevant extracted raw data on the right:
And, similarly, as a less detailed example, this is how Sabadell Airport looks on OpenStreetMap at the time of writing:
In general, the level of detail and standards used to map airports in OpenStreetMap can sometimes be inconsistent. This is, in part, unavoidable due to the collaborative nature of OpenStreetMap, but at the same time, this collaborative nature means that anyone can step in and improve the data. Certain general standards have been defined, and are discussed in the following pages:
X-Plane Scenery Gateway
Another fantastic data source for airports information that I explored and that ended up being very useful is X-Plane.
X-Plane is a popular commercial flight simulation platform developed by Laminar Research that aims to provide a realistic experience of flying airplanes and helicopters in a virtual global scenery that covers and recreates most of the Earth. To achieve this goal X-Plane naturally requires extensive and accurate data for as many airports around the world as possible, a goal that becomes considerably easier by leveraging help from the community. And this is where X-Plane Scenery Gateway comes into picture, the X-Plane Scenery Gateway is an open and collaborative portal and database for airport data to be used in the X-Plane flight simulator.
The X-Plane Scenery Gateway data can be easily obtained via a public API or via a dedicated Python package (which mostly acts as wrapper for the API). At the time of writing, a total of 39,544 airports are found in the X-Plane Scenery Gateway, with many of them being covered in great detail.
 Airports and heliports in the X-Plane Scenery Gateway. A total of 39,544 as of 2022-07-10.
One of the biggest limitations of the X-Plane data (but arguably also one of its strengths) is the format in which it is distributed.
It uses a custom file format, commonly known as the apt.dat file format, which has nothing in common with other standard GIS formats
but is specifically designed to accurately describe relevant visual and technical aeronautical information.
Unfortunately this also means that the support and tools available to work with these files is very limited (not to say non-existent). To work around it I ended up developing my own Python library to convert these files to much more usable formats (such as GeoJSON or ESRI Shapefile). You can read more about this in my last blog post.


Bonus fact: X-Plane uses OpenStreetMap data for many of its scenery features, such as roads and streets (but not for the airport layouts).
Summary
The following table summarizes the conclusions resulting from comparing the different sources I explored:
| Source | Pros | Cons |
|---|---|---|
| Official AIP |
|
|
| OpenStreetMap |
|
|
| X-Plane |
|
|
Final Results
Once I was more familiar with the available airport data and its possibilities I played around with making some airport posters using QGIS to load and style the data.
To build these, I combined data from the X-Plane Scenery Gateway and from OpenStreetMap. I used X-Plane Scenery Gateway for the airport layout (runways, taxiways, aprons, roads, and ground markings) and I used OpenStreetMap for the building’s footprints.

Additionally, as a final experiment I decided to create a combined poster with many of the airports in Spain (all the ones operated by Aena, 46 in total). In this case I used Python (with Matplotlib and GeoPandas) instead of QGIS. This allowed for a much more programmatic approach to building the grid layout and decorations.
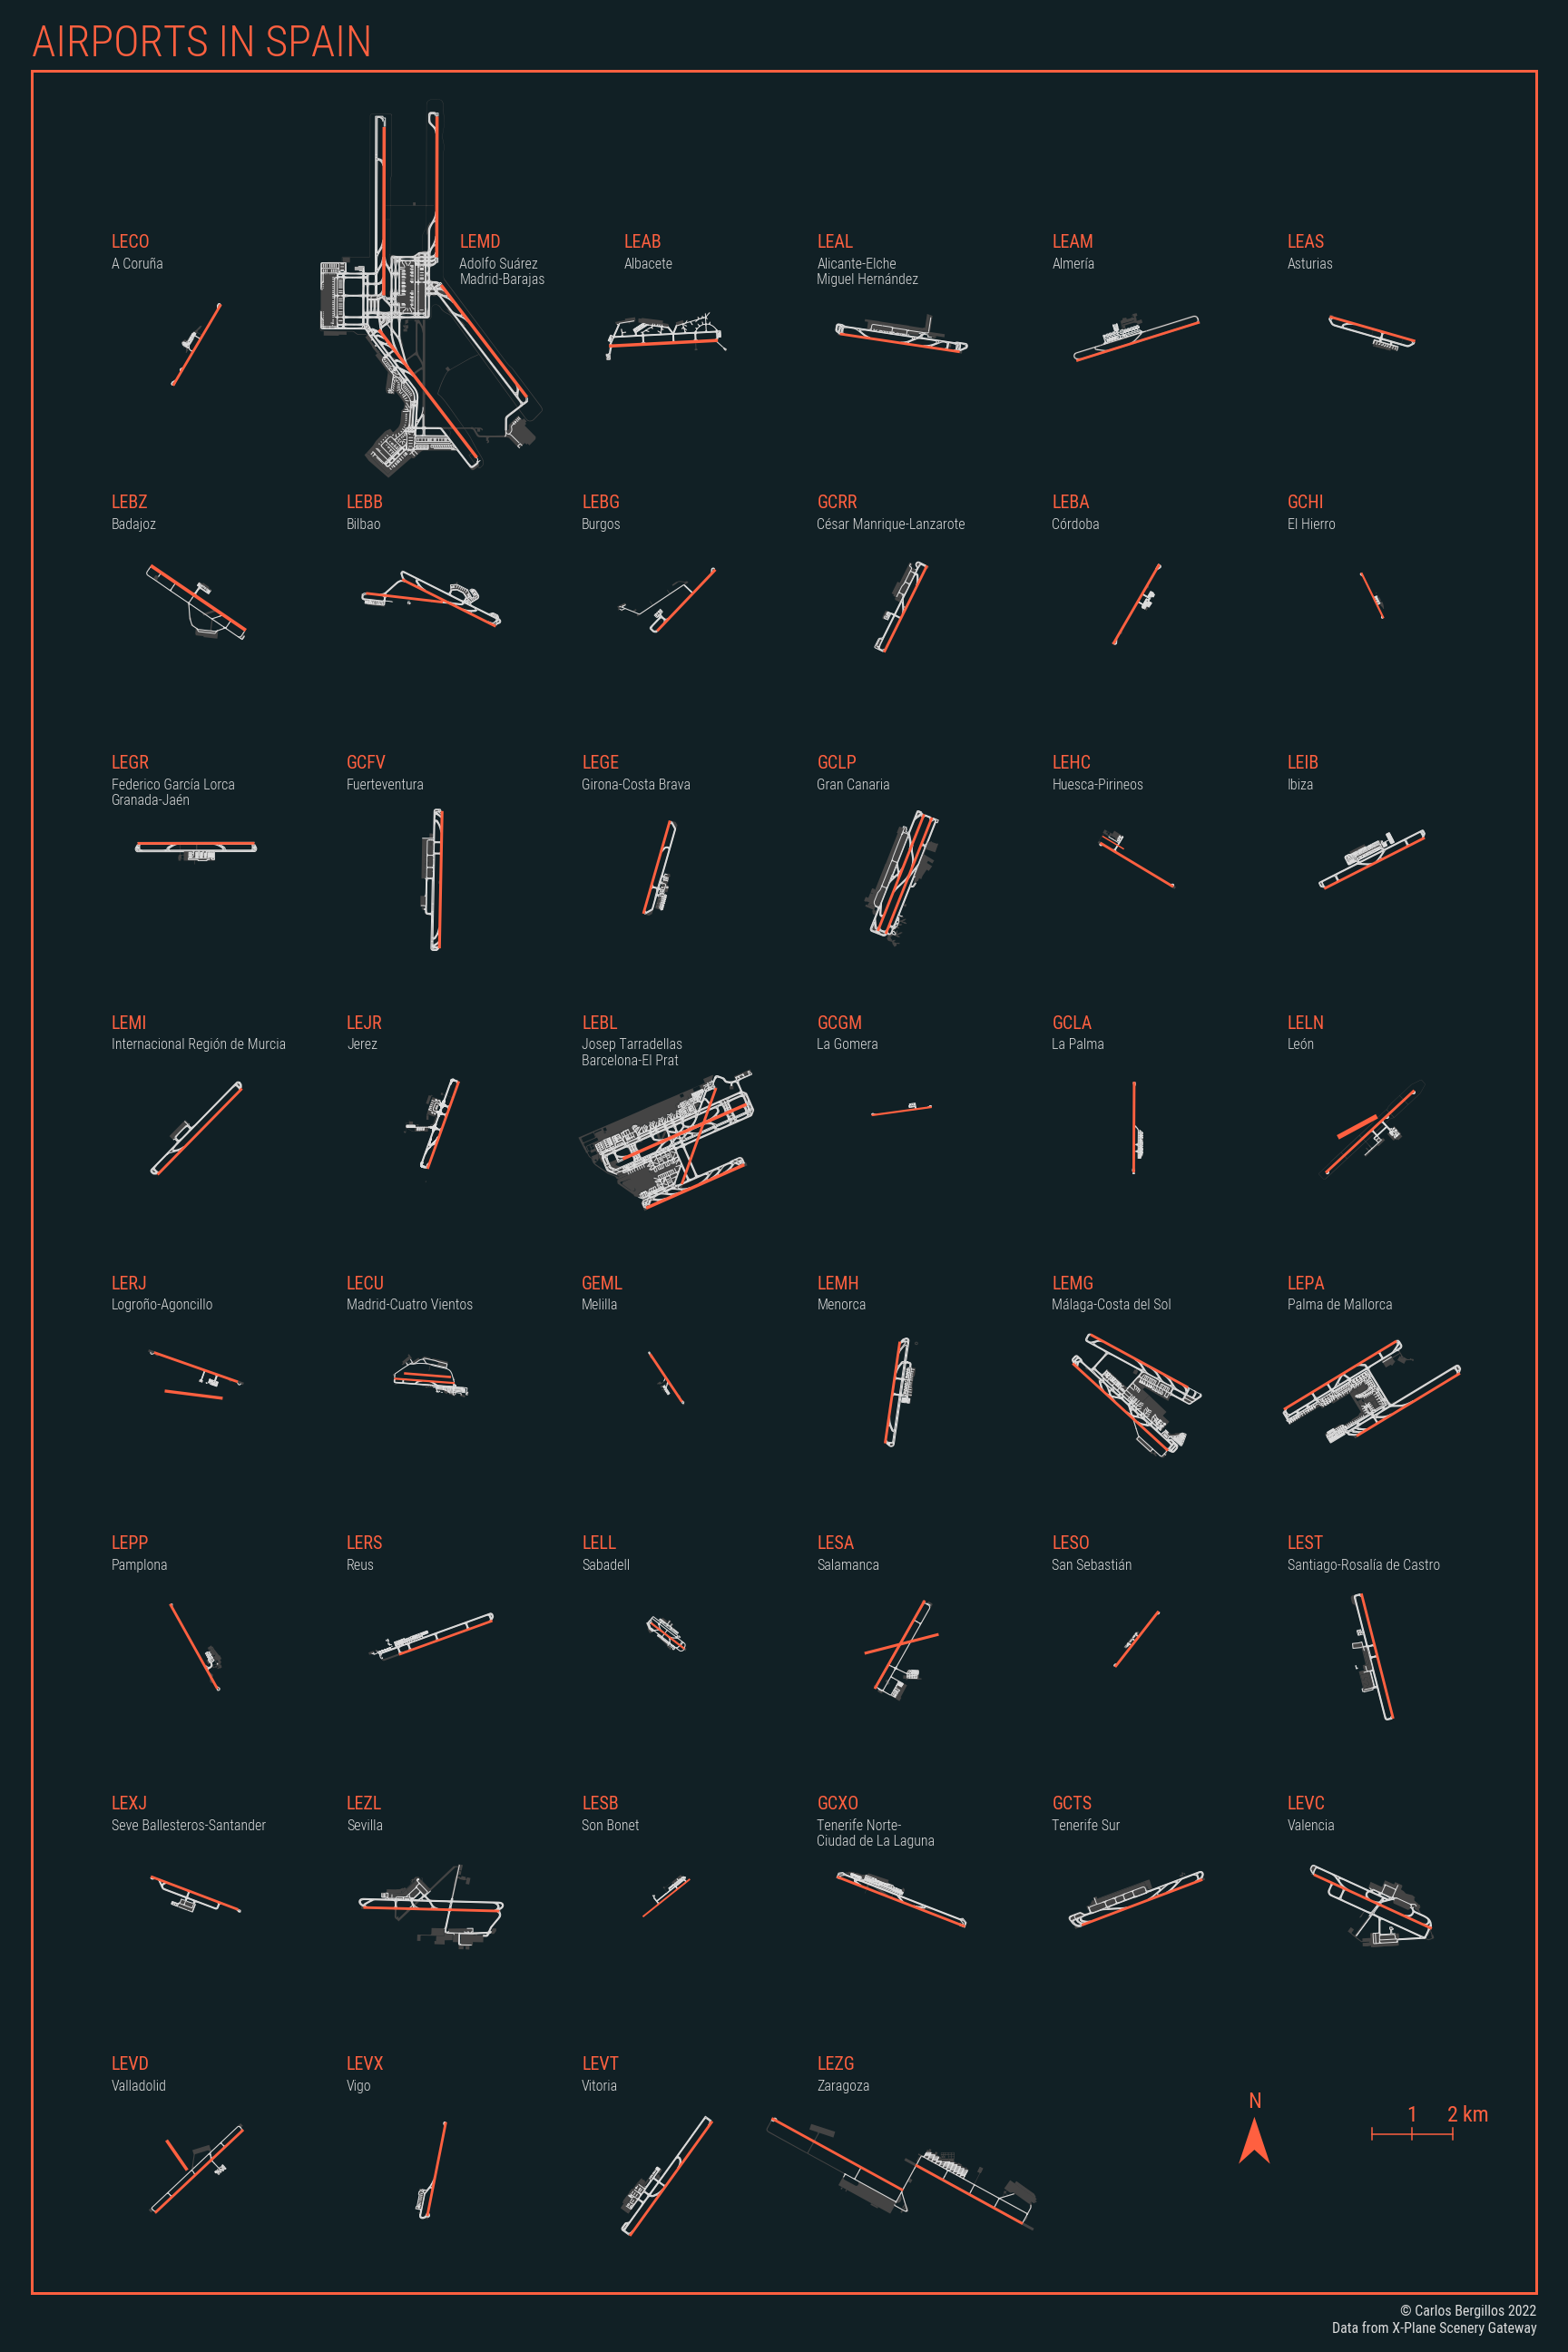
In this visualization all airports are mapped at the same scale, allowing us to see the differences in sizes between the airports at a glance. Madrid-Barajas airport and Barcelona-El Prat airport clearly stand out due to their large size, and, conversely, Sabadell airport (an airport I’m very familiar with and which regularly experiences a very considerable amount of traffic) ends up looking considerably tiny.