Musiverkko: Building and Exploring the Social Network of Music Artists
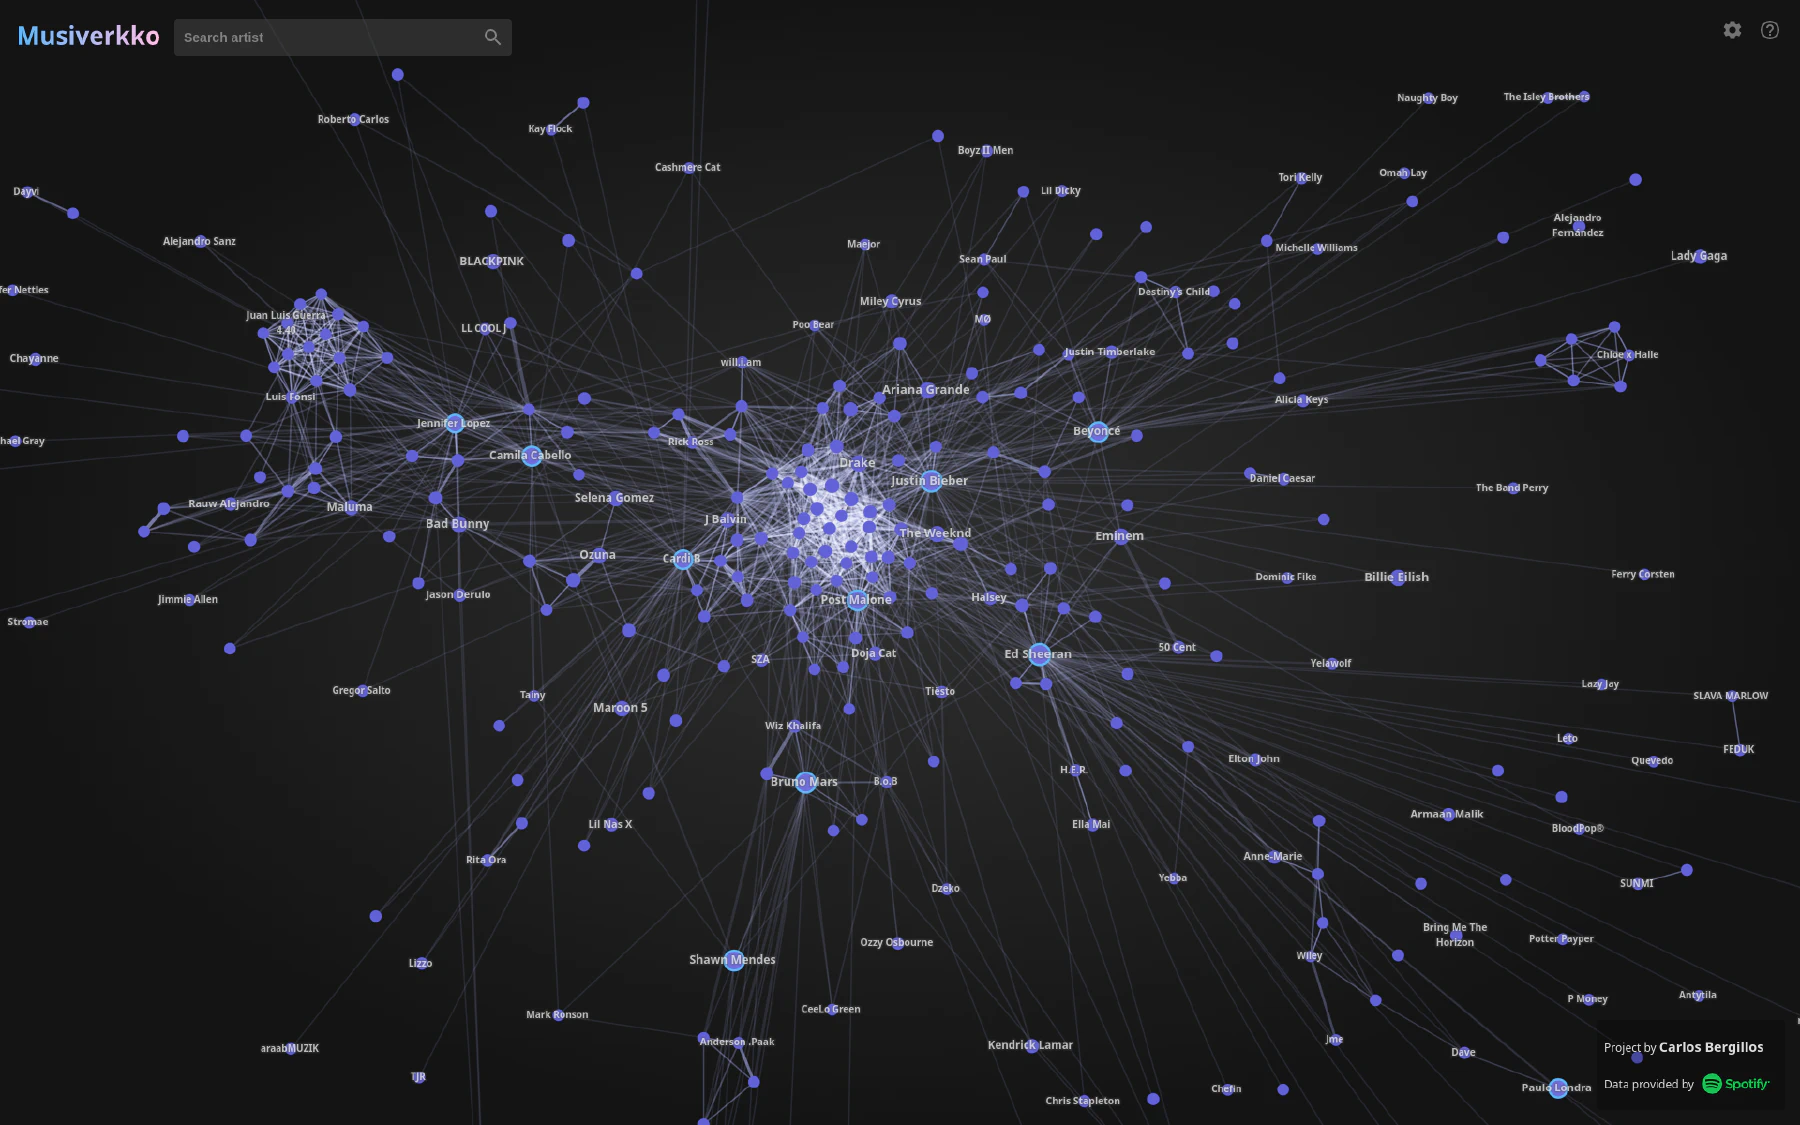
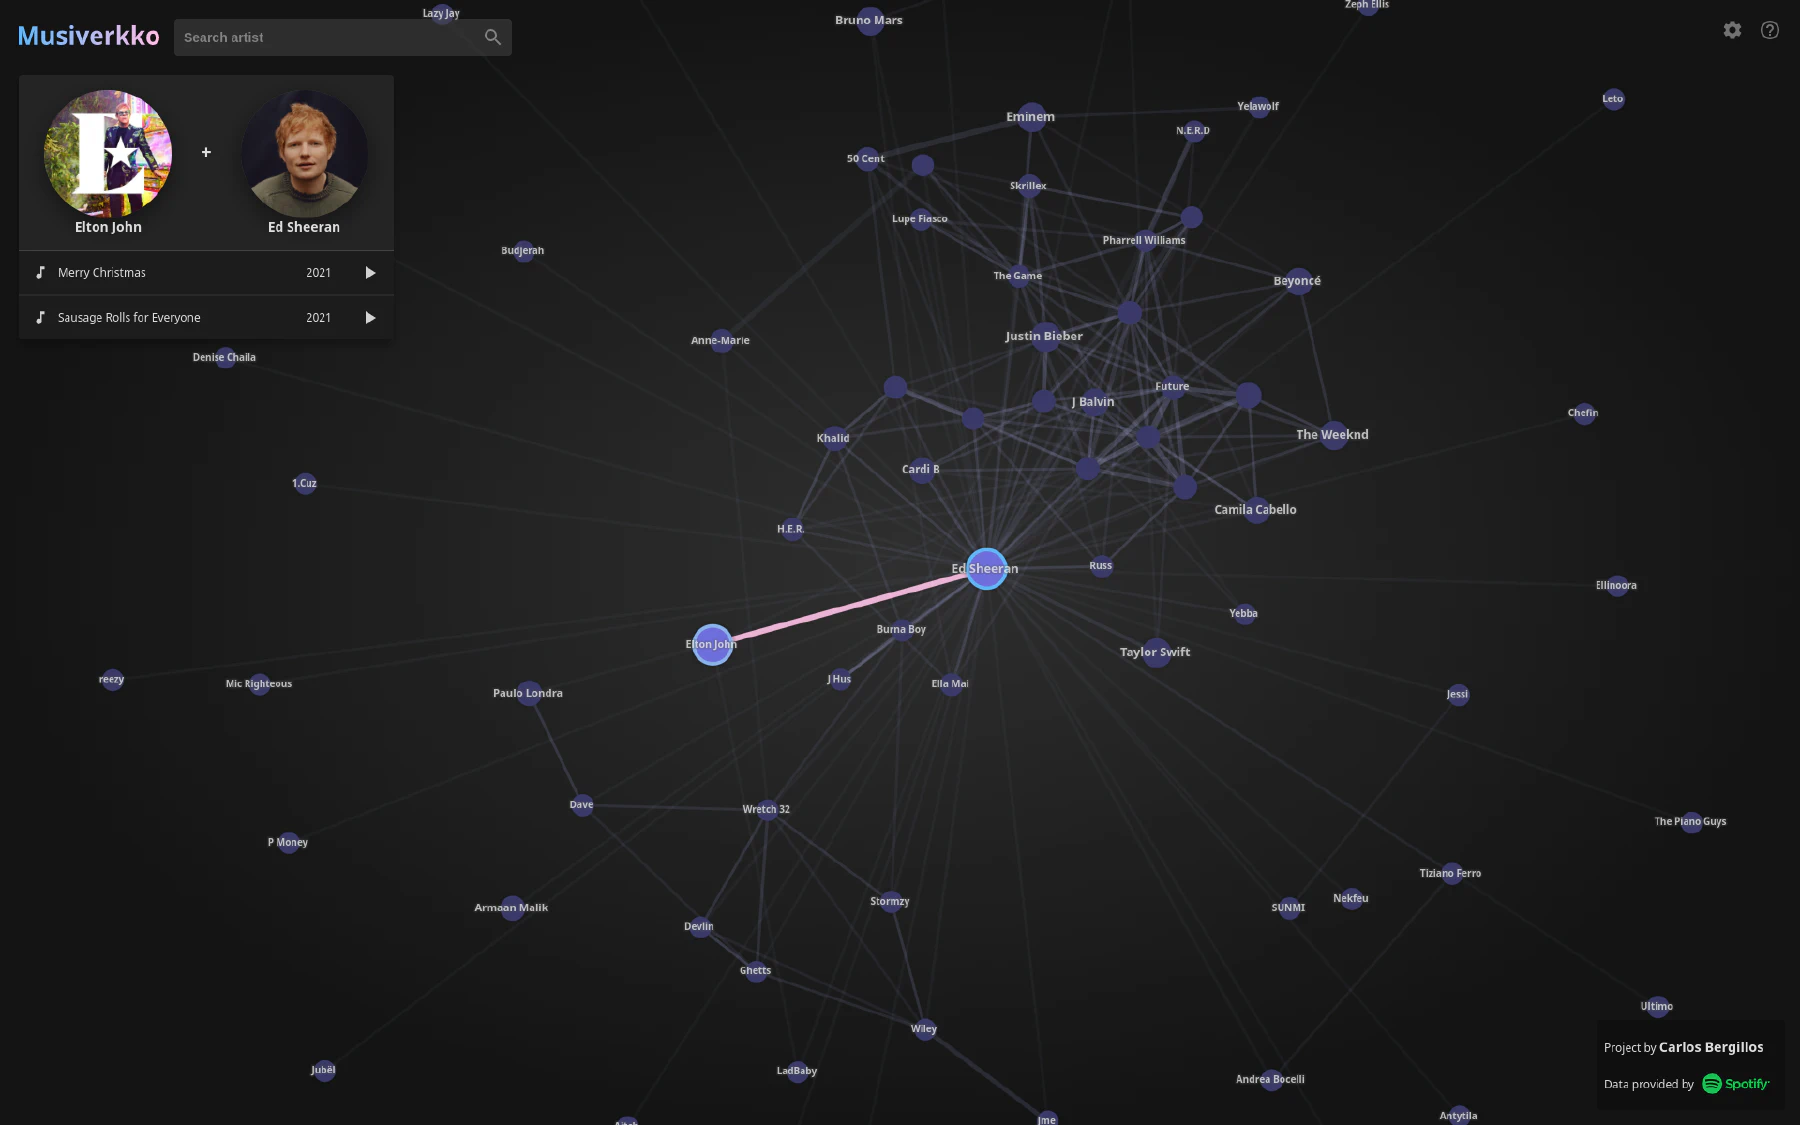
Music artists form a very natural social network, one in which artists are connected if they created and published music together. Following this basic idea we can end up obtaining a global network of music artists and find out that any two artists are probably mutually reachable in only very few hops through the network. And, as a much simpler use case, we can discover connections from our favorite artists that we maybe did not know about, and discover new artists and new music in the process.
As our data source we can use Spotify, which turns out provides a somewhat easy way to extract their catalogue of artists and songs. I was inspired to do this by different publications and projects which explored this network in great detail and proved that doing something like this was feasible:
- Tobin South. “Network Analysis of the Spotify Artist Collaboration Graph” (2018).
- Silvia Donker. “Networking data. A network analysis of Spotify’s socio-technical related artist network” (2019).
- Bernhard Rieder. “Spotify Artist Network”.
- Sunny Amrat. “Six Degrees of Kanye West”.
- Emily Louie. “Six Degrees of Spotify”.
Musiverkko
Something I was missing was a way to explore this network in an interactive and smooth way. To solve this I ended up building Musiverkko.
Explore the interactive application at: musiverkko.com.
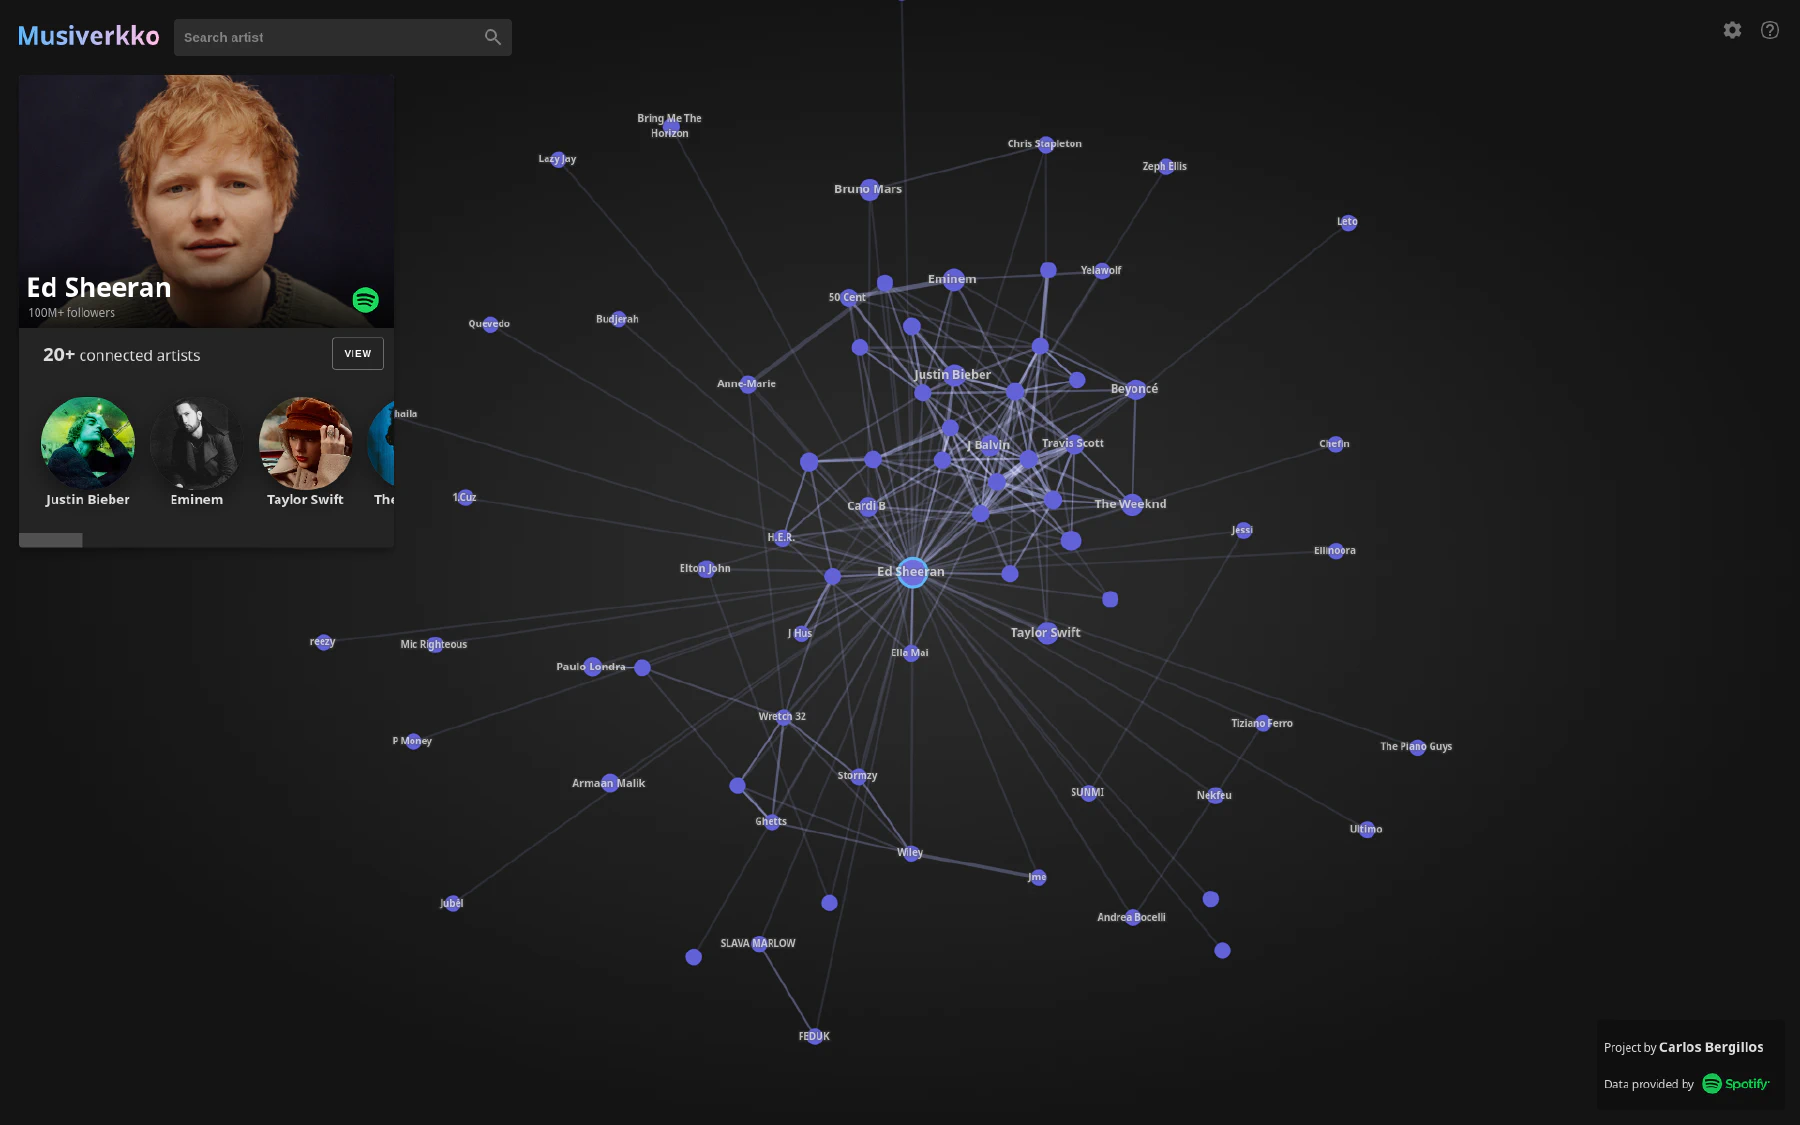
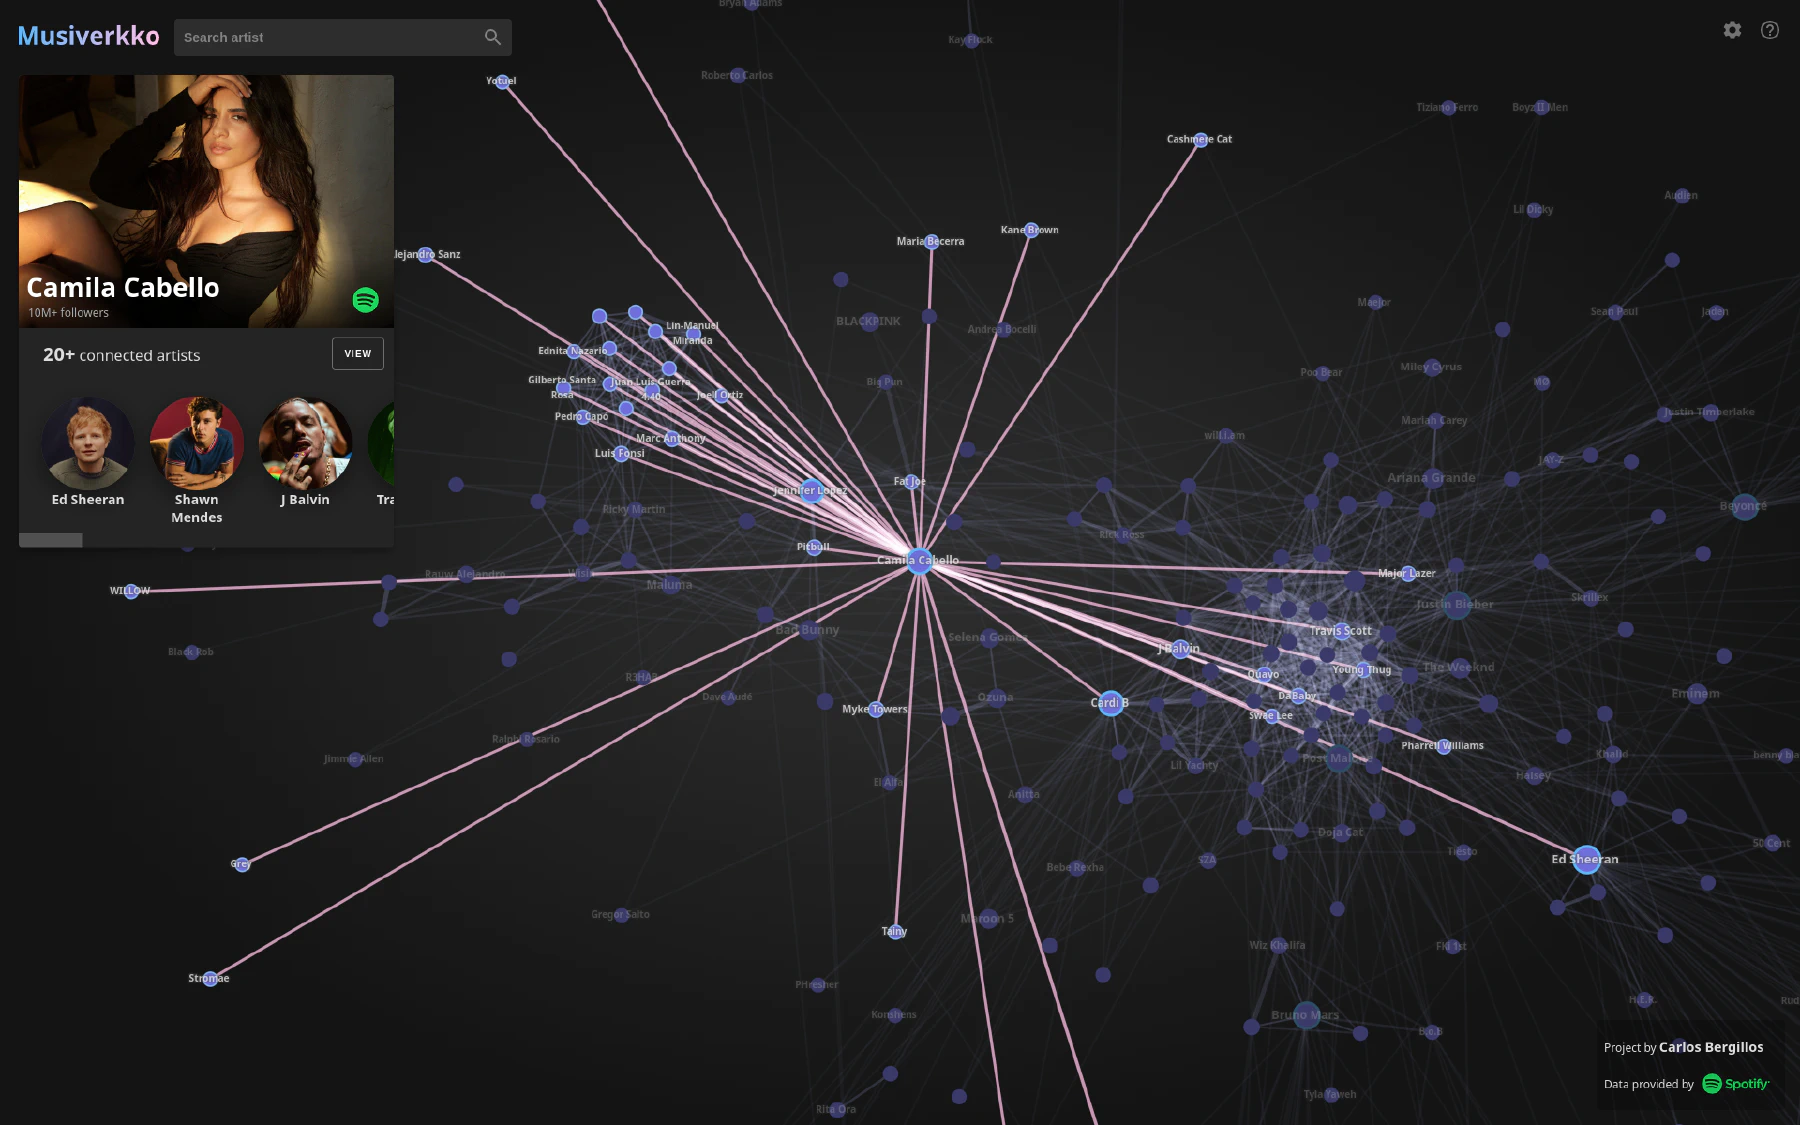
In this article I will provide an overview of how Musiverkko was built and how it works.
Data Collection
To accomplish this we obviously need data, a lot of data about artists and their collaborations. Since we are aiming high, we want a database that contains as many artists from all around the world as possible to construct this global network of music artists.
Spotify Web API
In other domains this would maybe be an impossible task, but luckily, in this case Spotify provides open access to all of their music catalogue in a straightforward way via the Spotify Web API, from which we can obtain all the data about artists and songs that we need to build a graph like this. The only limitations are the huge amount of API requests that are needed in total and the size of the resulting database, but both these aspects are still quite manageable.
One caveat though, is that the Spotify Web API does not provide a direct way to obtain a list of the connected artists for a given artist. Instead, we need to exhaustively traverse all of the albums of the artist, and for each album traverse all of the songs looking for other artists that also participated in the song.
Building the Graph
Starting with a single initial artist, we explore and store all of this artist’s connected artists, and then, for each of the connected artists, we repeat the process exploring and expanding their respective connected artists. We continue this process until there are no new artists to expand. This approach is pretty much what is known as a breadth-first search.
With this, we end up exploring and discovering the whole connected component to which the artist we started with belongs to. This means however, that artists that have no connections (and artists that are outside this initial connected component) are unreachable and will not be discovered. This is not really a major problem since we will make the assumption that a giant connected component exists, that is, we assume that a very significant fraction of all the artists are part of one same connected subgraph. This giant component behaviour is typical of small-world networks like the one we have at hand, and it is further corroborated by the different results shared by the publications cited before (and most if not all of them used a very similar exploration strategy).
The choice of initial artist should not make a difference in the results as long as this initial artist is part of the main giant component, so any mainstream artist will do.
All in all, capturing the complete giant component is still a very ambitious task. In order to not surpass the Spotify API rate-limits I used generous delays between requests. In the beginning I was exploring and fetching all artists, but I eventually decided to only explore and fetch artists with more than 10 thousand followers. This allowed the process to end a lot quicker and would also make the application and queries run faster while still including all the most relevant artists that people would be likely to search for. Even with this, the complete extraction process to build the graph took 3 days.
Graph Characteristics
The graph of music artists built has the following characteristics:
- The graph is undirected. An artist A collaborating with artist B is the same as the artist B collaborating with artist A. Of course one could find a way to give direction to the edges in some cases (e.g. primary artist 🠖 featuring artist), but this would not apply to all songs (there can be many primary artists in a song) and artists can participate in a song in many different ways, and this is not detailed in the data obtained from the Spotify Web API anyway.
- The graph is weighted. A connection between two artists can be weak or strong, based on the number of songs they have both worked together in.
- The graph nodes are also weighted. It is also very straightforward to define a value of weight or importance for the graph nodes, proportional to the artist’s popularity and/or number of followers.

Database
We obviously also need a database to store the relevant data during the extraction process and to make the final graph available to the application.
Graph Databases
My initial thought was to use a graph database (like Neo4j), after all, being this a graph, the decision had never been as obvious, right? Well, having never tried graph databases before I decided to give Neo4j (and ONgDB) a go.
Although very promising at first, I ended up switching to a more traditional relational database in the end. Some of the aspects of graph databases that led me to such a decision were:
- Cost. Either using an “as a service” solution like Neo4J’s Aura DB or Amazon Neptune, or self-hosting the graph database, are all currently more expensive than using other more traditional approaches.
- Difficulty in building complex queries. I encountered some limitations in Neo4j’s Cypher query language when trying to build some transformation queries on the data. To be fair, this could be in part the result of my inexperience with such language.
- Potential vendor lock-in. Due to the very different approaches used by different graph database platforms, migrating data between them (if needed some day) does not really seem straightforward.
- No clear benefits for my use cases. I don’t really need to run any complex graph algorithms, I just need basic lookups by ID for artists and connections, which are all very fast in relational databases when using indexes.
All in all, using a graph database just seemed more impractical and risky, with no incentives in sight to continue with that approach.
SQLite
I then used PostgreSQL as the database system for Musiverkko, but then moved to a SQLite database shortly after. Of course many will argue that SQLite is not suitable for a production server, and they might be right, but it turns out I do not really need a production server for Musiverkko, and SQLite fulfills all my requirements. The reasons for switching to SQLite were mainly portability and cost, and again, also no clear benefits existed in using a server-managed solution like PostgreSQL.
Each SQLite database is just a file. This removes dependencies between the data and the runtime environment required, greatly simplifying the deployment. Using a PostgreSQL database requires using a separate dedicated server to run and manage the database (or using a dedicated database-as-a-service solution). With SQLite such necessity does not exist.
The fact that each SQLite database is a file also implicitly provides the capability of storing different historical snapshots of the database and backups in a very easy way. Each historical snapshot of the graph is simply a separate SQLite file.
On the other hand, one of the big disadvantages of SQLite is its weak support for concurrently-heavy write operations on the database. SQLite started as an embedded database solution, and as such, its main use case is in single-client situations, where concurrent write operations are not expected. Luckily, our use case is exclusively read-only in production, concurrent writes are not needed. Writing to the database only happens when we initialize the database the first time, and even this happens using a single thread in a dedicated separate machine. And even if we want to rebuild the graph periodically (extracting the most recent data from the Spotify API), we will be writing to a new separate file each time.
Additionally, the final production database file is incredibly small (98 megabytes at the moment). Only the artists with more than 10 thousand followers on Spotify are kept in the production database (under 100 thousand artists pass this filter at the moment). The database contains only two tables: artists and connections. And each table only contains the absolutely necessary structural information in order to build and display the graph: artist IDs, track IDs, node names and node weights. Any other extra information, such as artist image URLs, track names, track release dates, track preview URLs (among other fields) are not stored in the database and are instead pulled from the Spotify API on demand when using the application.
Backend
The backend of the application consists of a REST API with a handful of read-only endpoints which can be divided in two groups:
- Graph queries. For a given artist ID, return the neighborhood subgraph for that artist. This data is obtained from querying the SQLite database containing the complete graph.
- Artist and track information queries. For a given artist ID or track ID, return detailed information about them, such as image URLs, complete names, number of followers, or audio preview URLs, among other fields. This data is obtained directly from the Spotify API, and as such it is as always the most recent.
Python
This backend server has been built using Python and FastAPI. Additionally, SQLAlchemy (via SQLModel) is used to make database queries and read data from the SQLite database.
Docker
I decided to use Docker in order to make deploying and running the backend server in the cloud more straightforward. The resulting Docker container is not too complex. In short, we start with a base Python 3.9 image and then:
- Install the required Python dependencies.
- Copy the custom Python code of the FastAPI server.
- Copy the SQLite database file (less than 100 megabytes).
Serverless
I had a clear idea I wanted to go serverless with this project in order to hopefully reduce costs by not having a server running 24/7 while also having the option to easily scale.
I am using AWS Lambda to run the Docker container image as a lambda function. It is providing quite quick cold-start times (around 2 seconds), and also very quick response times (around 200 ms) for all subsequent requests that reuse a running lambda instance.
With this approach, and given that each container image running in a lambda contains a full copy of the database, no central database bottlenecks exist. Instead, each running lambda instance is also essentially acting as a read-only replica of the database, eliminating database concurrency problems. Horizontal scaling is very straightforward and simply consists on increasing the maximum number of concurrent lambda instances allowed.
Frontend
I decided not to use any frontend fameworks (like React, Angular or Vue.js) and write everything in pure HTML, CSS and JavaScript. After all, all I need is a single-page application with literally a single page: a graph component that takes up the whole window with only some basic widgets and cards on the sides. I do, however, use Parcel as the builder/bundler for the site.
Drawing the Graph
Drawing the graph and interacting with it are probably the most important aspects of the whole application. It needs to be a pleasant and smooth experience even with thousands of nodes and links.
My initial approach was to use D3.js as used here: Force-Directed Graph. Unfortunately, this quickly proved to have serious performance problems for any non-small graph. This D3.js approach creates the nodes and links as individual elements in an SVG object, which ends up easily overloading the DOM and causing very poor framerates.
I also tried drawing the graph with the Canvas API, and, even though it showed better performance than the SVG, it was still insufficient for my requirements.
I eventually had to resort to using WebGL. Even though it is significantly more difficult to work with than Canvas and SVG, WebGL vastly outperforms them both by more directly leveraging the GPU. In this way, I ended up writing my own ad-hoc graph visualization and interaction library for Musiverkko. It uses D3.js (see d3-force) as the graph layout simulation engine and WebGL to do the drawing.
Acknowledgments
The following frontend libraries played a part in the development of Musiverkko:
- D3.js: Used for DOM manipulation and its force-directed graph layout algorithms.
- WebGL-BatchDraw by lragnarsson: Served as a base to get started with WebGL.
- force-graph and 3d-force-graph by vasturiano: Served as inspiration for how to manage graphs on the web.
- glMatrix: Used for efficient matrix manipulations working together with WebGL.
- RBush by mourner: Used to efficiently detect and prevent label overlaps.
- Dexie.js: Used to efficiently and easily work with the IndexedDB API (used to cache some graph information in the browser).
Also take a look at the references listed in the introduction of this post, they served as great inspiration.