Quick Visibility Graphs Computation in Python

The final thesis of my computer science degree at the Universitat Politècnica de Catalunya (UPC) explored the concept of visibility graphs as applied to time series analysis1.
What?
First, let’s define what are these visibility graphs, as introduced by Lucas Lacasa et al., 20082.
In short, visibility graphs are a way of transforming an input time series into a graph (a set of nodes and edges, also called a network). In particular:
- We have a node for each data point in the time series.
- We have an edge between two nodes if there is unobstructed line-of-sight visibility between the two data points in the time series (we can imagine the time series as a series of columns with vantage points at the top).
For a simple visual example see:
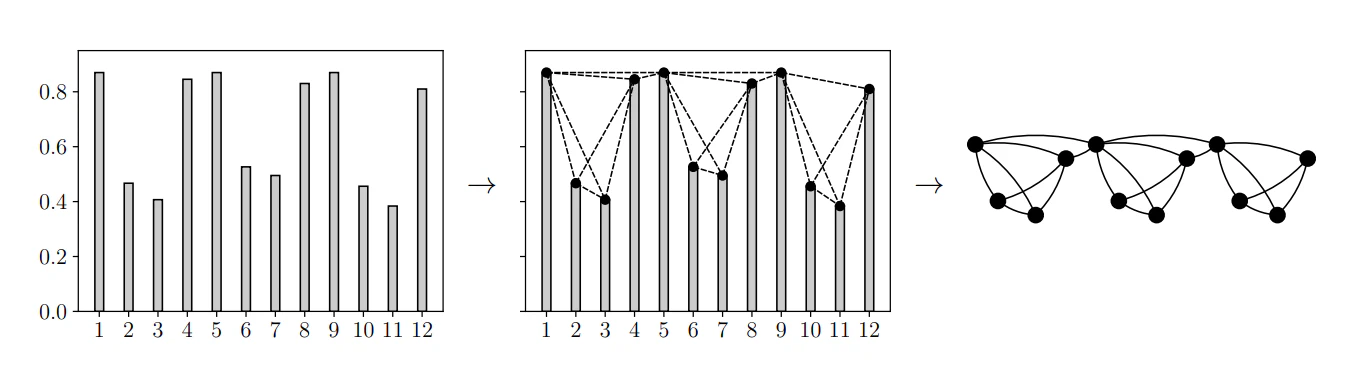 Original time series on the left, construction of the visibility graph in the middle, and final resulting graph on the right.
These are sometimes called natural visibility graphs, to distinguish them from other variations such as horizontal visibility graphs3.
Additionally, directed and/or weighted graphs can be constructed by taking, for example, the lines direction, length, or angle into account.
Why?
By converting time series to graphs we open the door to using a multitude of mature (and not so mature) analytical methods and algorithms from the fields of graph theory and complex networks theory to be now also available for time series analysis. So, in short, the power of visibility graphs resides in offering a new way of studying time series from a completely different perspective.
Graph analysis methods applied to visibility graphs have been proven to offer useful applications in:
- providing useful insights into the structure of the time series, like its volatility
- providing new features to be used by classification algorithms for improved classification of time series
- providing capabilities for the segmentation of time series (via graph clustering algorithms)
- and more
Research on the full potential applications and limitations of visibility graphs is still a topic of active ongoing research.
How?
As part of my thesis work, I developed the Python ts2vg library, available on GitHub and PyPI.
With it, it is very easy and quick to obtain the visibility graph of a time series in very few lines of code:
from ts2vg import NaturalVG

ts = [1.0, 0.5, 0.3, 0.7, 1.0, 0.5, 0.3, 0.8]

g = NaturalVG()
g.build(ts)

edges = g.edges
See the full documentation and more examples here.
ts2vg uses a divide-and-conquer algorithm4 and a custom C backend (via Cython) for improved performance, providing very quick results even for large time series with millions of data points.
-
C. Bergillos, A. Arratia. “A study of visibility graphs for time series representations” (2020). ↩︎
-
L. Lacasa, B. Luque, F. Ballesteros, J. Luque, and J. C. Nuño. “From time series to complex networks: The visibility graph” (2008). ↩︎
-
B. Luque, L. Lacasa, F. Ballesteros, J. Luque, “Horizontal visibility graphs: exact results for random time series” (2010). ↩︎
-
X. Lan 1, H. Mo, S. Chen, Q. Liu, Y. Deng, “Fast transformation from time series to visibility graphs” (2015). ↩︎